In your daily operations, it’s likely that you notice your processes and ‘activities’ constantly changing – sales trends and volume, marketing performance metrics, warehouse operational shifts, or inventory management changes, among many others.
All these little alterations in your organizational activities are impacting the global well-being of your company, your warehouse, your restaurant, or even your healthcare facility. Whether you manage a big or small company, business reports must be incorporated to establish goals, track operations, and strategy, to get an in-depth view of the overall company state.
But with so much information being collected daily from every department, static business reports created manually will not provide your company with the fresh insights it needs to stay competitive. Businesses that want to succeed in today’s crowded market need to leverage the power of their insights in an accessible and efficient way. This is where modern business reports created with interactive data visualizations come to the rescue.
Traditional means of reporting are tedious and time-consuming. Due to the way the human brain processes information, presenting insights in charts or graphs to visualize significant amounts of complex information is more accessible and intuitive. Thanks to modern, user-friendly online data analysis tools armed with powerful visualizations, companies can benefit from interactive business reports that are accessible and understandable for everyone with no need for prior technical skills.
Here we take the time to define a business report, explore visual report examples, and look at how to create them for various needs, goals, and objectives. In the process, we will use an online data visualization software that lets us interact with, and drill deeper into bits and pieces of relevant data. Let’s get started.
What Is A Business Report?
A business report is a tool that helps in collecting and analyzing historical and current data from a company’s operations, production, and more. Through various types of business reports, organizations make critical decisions to ensure growth and operational efficiency.
To understand the best uses for these reports it’s essential to properly define them. According to authors Lesikar and Pettit, “A corporate-style report is an orderly, objective communication of factual information that serves some organizational purpose”. It organizes information for a specific business purpose. While some reports will go into a more detailed approach to analyzing the functionality and strategies of a department, other examples of business reports will be more concentrated on the bigger picture of organizational management, for example, investor relations. That’s where the magic of these kinds of reports truly shines: no matter for which company goal you need, their usage can be various and, at the same time, effective.
Traditional business reports are often static and text reach (bullet points, headings, subheadings, etc.). Classically formatted in sections such as the summary, table of contents, introduction, body, and conclusion, this report format is no longer the most efficient when it comes to extracting the needed insights to succeed in this fast-paced world. On one hand, by the time these reports have been finished, the insights included within them might not be useful anymore. And on the other hand, the fact that it is mostly text and numbers makes them hard to understand, making the analysis strategy segregated and not efficient.
The visual nature of modern business dashboards leaves all the aforementioned issues in the past. Thanks to interactive data visualizations and modern business intelligence solutions, the analysis sequence can be done fast and efficiently while empowering non-technical users to rely on digital insights for their decision-making process.
Types Of Business Reports
Before creating your business outcome reports it is important to consider your core goals and objectives, this way you will be able to pick the right type of report for each situation. Here we present you with 5 common types of visual business reports that you can use for different analytical purposes.
1. Analytical reports
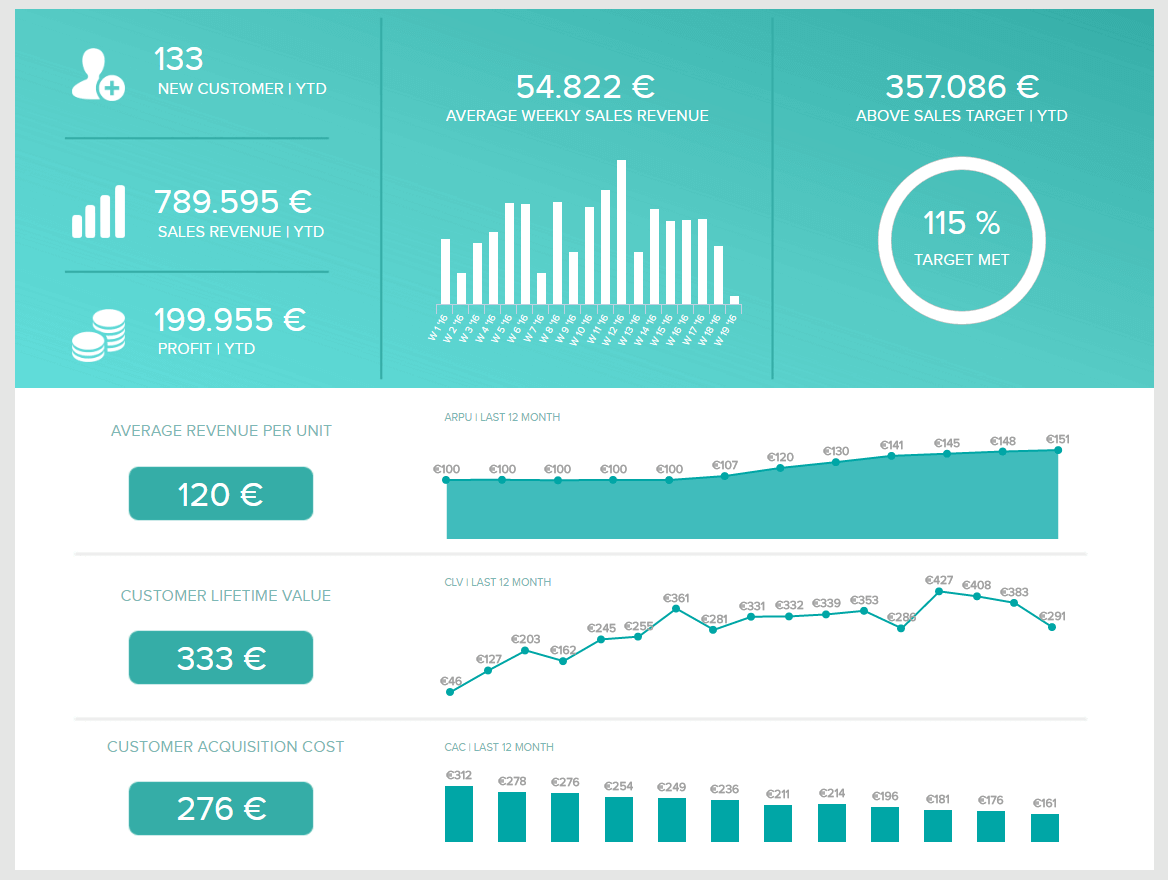
Analytical reports are business reporting tools that use qualitative and quantitative data to analyze the performance of a business strategy or as support when a company needs to make important decisions. A modern analytical dashboard created with a report tool can include statistics, historical data, as well as forecasts, and real-time information. Let’s look into it with a sales example.
**click to enlarge**
This visually appealing business analysis report is full of relevant sales KPIs to measure performance such as the average revenue per unit, the customer lifetime value, acquisition costs, as well as some sales targets to be met. The value of this analytical report lies in the fact that you get a lot of relevant metrics in a single dashboard. The data can be filtered and explored on different time frames such as daily, weekly, monthly, or quarterly, depending on the discussion that it needs to support.
With this kind of business report sample in hand, managers can quickly understand if they are meeting their targets, find improvement opportunities, get a bigger picture of their sales, and find efficient ways to proceed with new strategies.
2. Research reports
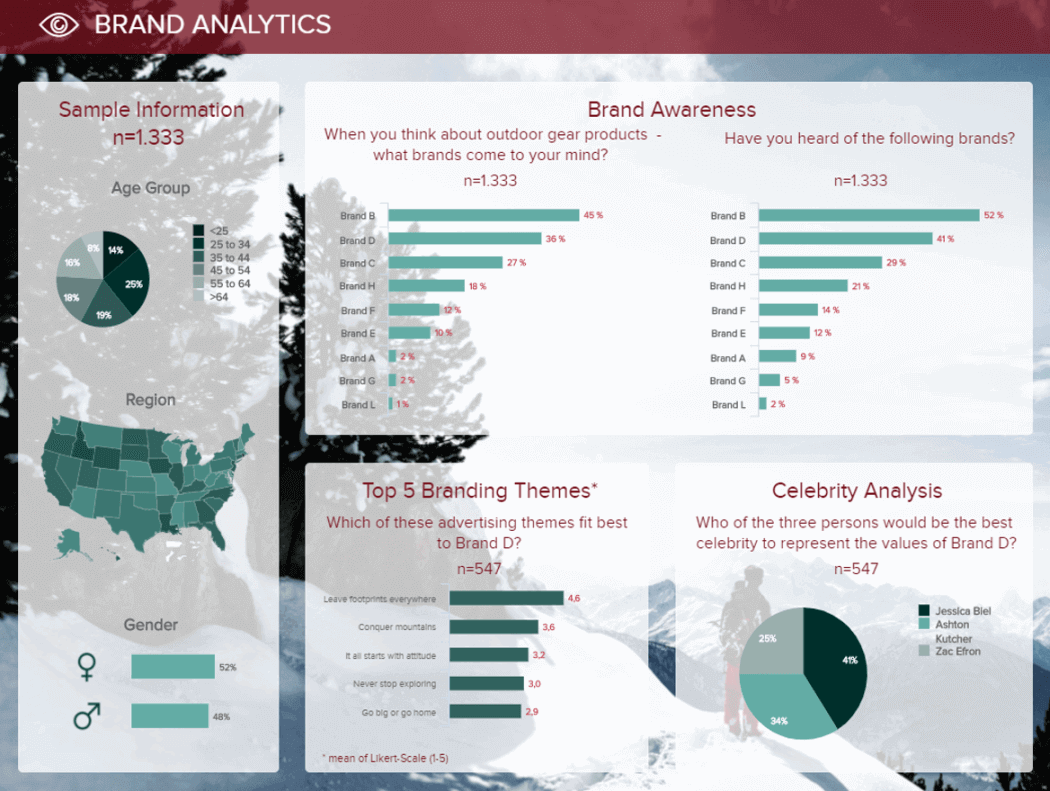
Next in our types of business reports that we will discuss is a research report. Companies often use these kinds of reports to test the viability of a new product, study a new geographical area to sell, or understand their customer’s perception of their brand image. To generate this type of business report, managers often contact market research agencies to gather all the relevant information related to the studied topic. This brand analysis dashboard is a great example.
**click to enlarge**
The image above is a business report template of a brand analysis. Here we can see the results of a survey that was conducted to understand the brand’s public perception on different topics. The value of this market research dashboard lies in its interactivity. Often, research reports are depicted in long and static PowerPoint presentations. With a modern market research dashboard like this one, all the info can be filtered upon need and the whole presentation of results can be done on one screen. For example, if you want to know the brand awareness of a particular region or age group, you just have to click on the graphs and the entire dashboard will be filtered based on this information. Like this, the analysis sequence is fast, interactive, and efficient.
3. Industry reports
Following on from the research topic, our next type of business report is an industry report. Benchmarks and targets are excellent ways to measure a company’s performance and success. But, these targets need to be based on realistic values, especially considering how crowded and competitive today’s markets are. For this purpose is that companies perform industry reports, by getting a clear picture of the average industry numbers such as the competitive landscape, industry size, economic indicators, and trends they can plan smart strategies and create realistic targets for performance.
**click to enlarge**
Let’s take this industry report by Technavio about the Global Ice Cream Market as an example. Here we can see relevant numbers concerning the ice cream market, how it was impacted by COVID-19, and what is expected to happen between the years 2020-2024. For example, the business report sample shows that the ice cream market has actually been positively impacted by the pandemic and that it grew 4.33% during 2020. The report also shows that there is increasing popularity of plant-based ice cream and that this trend is driving market growth. This is invaluable information for an ice cream company as they have an opportunity to invest in new products with almost certain success.
4. Progress reports
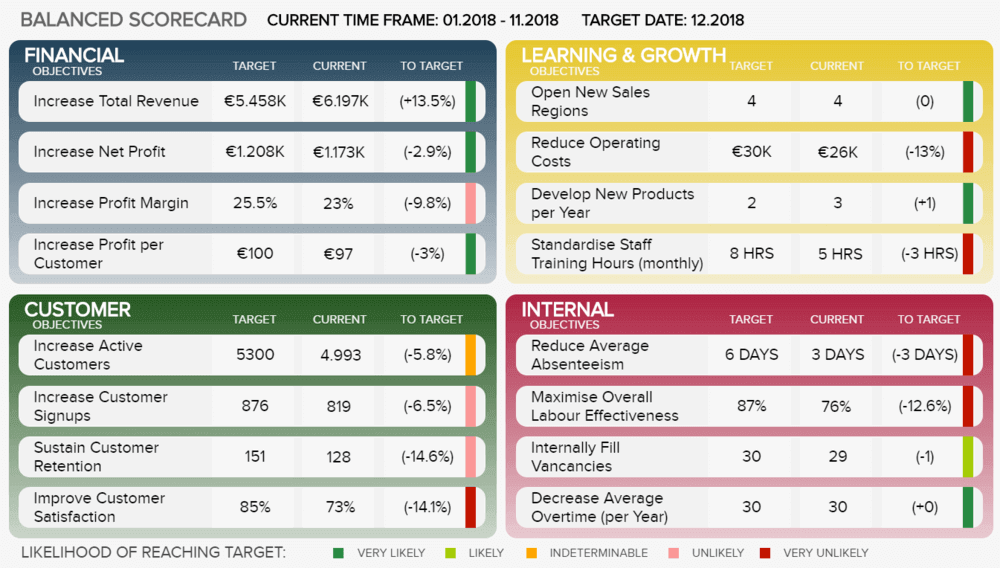
Next, we have progress reports. Unlike our other examples, this type of business report is not necessarily based on deep research or advanced analytics, but rather on delivering a clear picture of the performance of a particular area or business goal. Their visual nature makes them the perfect tool to support meetings or business discussions as they provide a glance into the status of different metrics. A common use of progress reports is with KPI scorecards. Let’s look at an example.
**click to enlarge**
The image above is a business report example of a balanced scorecard. The goal here is to quickly understand the development of metrics related to 4 key business areas: financial, customers, learning and growth, and internal objectives. Each of these metrics is displayed in a current value and compared to a set target. Paired with this, the business report template has 5 colors for the performance status. This allows anyone who uses this report to quickly understand just by looking at the colors if the target is being met.
5. By business function
Getting a bigger picture of a company’s performance is a great benefit of modern business reports. But, apart from helping the company as a whole, the real value of these reports lies in the fact that they empower departments to leverage the power of data analysis for their decision-making process. Rather is the sales department, human resources, or logistics, your entire organization will be data-driven. Let’s look at it with a business report example by function on marketing.
**click to enlarge**
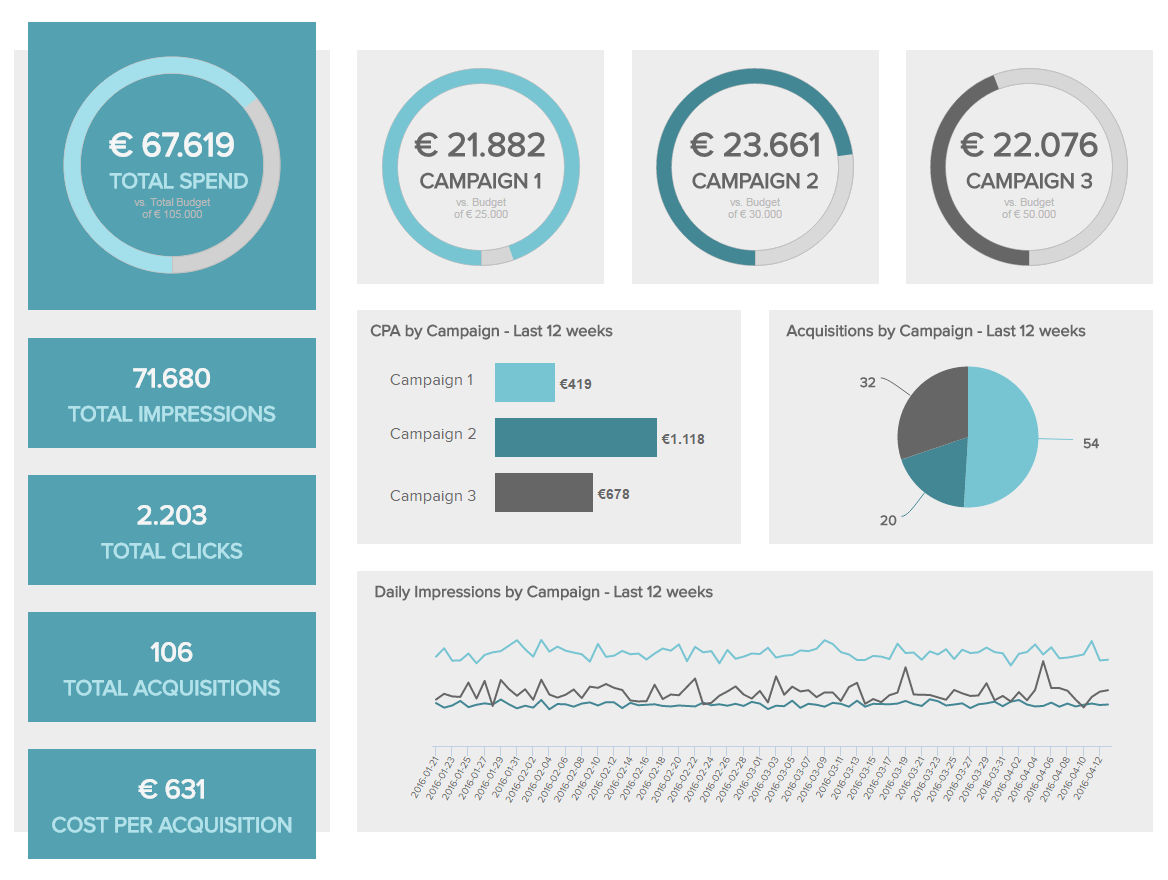
Created with modern marketing dashboard software, this business report example is fully focusing on the development of marketing campaigns. With metrics such as the total number of impressions, clicks, acquisitions, and cost per acquisition, being depicted on intuitive gauge charts, you quickly get a clear understanding of the performance of your campaigns. Through this, you can spot any inefficiencies before they become bigger issues and find improvement opportunities to ensure your marketing efforts are paying off. If you want to dig even deeper, this interactive business report can be filtered for specific campaigns so you only see insights related to it, making this dashboard the perfect tool to support team meetings.
Business Report Examples And Templates
We’ve answered the question, ‘What is a business report?’ and now, it’s time to look at some real-world examples.
The examples of business reports that we included in this article can be utilized in many different industries, the data can be customized based on the factual information of the specific department, organization, company, or enterprise. Interdepartmental communication can then effectively utilize findings and the content can be shared with key stakeholders.
Now that we know what they are, let’s go over some concrete, real-world instances of visuals you will need to include in your reports.
1. Visual financial business report example
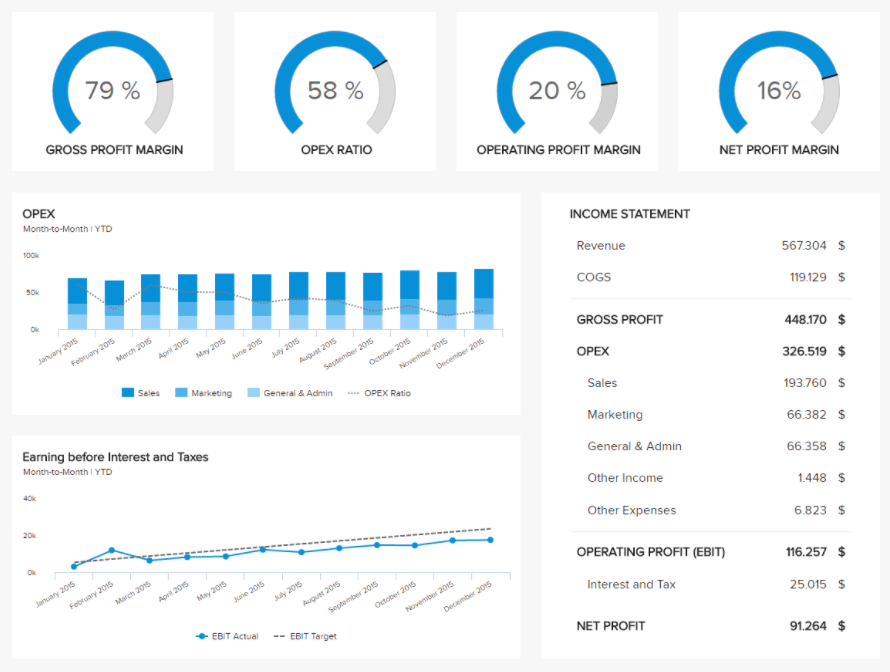
This first example focuses on one of the most vital and data-driven departments of any company: finance. It gathers the most essential financial KPIs a manager needs to have at his fingertips to make an informed decision: gross profit margin, operational expenses ratio (OPEX), both earning before interests (EBIT) and net profit margins, and the income statement. Next to these are the revenue evolution over a year compared to its target predefined, the annual evolution of operational expenses for various internal departments as well as the evolution of the EBIT compared to its target.
**click to enlarge**
The different sets of visual representations of data can clearly point out particular trends or actions that need to be taken in order to stay on the financial track of a company. All your financial analysis can be integrated into a single visual. When the presentation becomes interactive, clicks will provide even deeper insights into your financial KPIs, and the desired outcomes to make a company healthy in its financial operations. The importance of this finance dashboard lies in the fact that every finance manager can easily track and measure the whole financial overview of a specific company while gaining insights into the most valuable KPIs and metrics. Empowering a steadfast and operation-sensitive plan is among the most important goals a company can have, and finance is right in the middle of this process.
Thanks to all this information displayed on a single dashboard, your report is greatly enhanced and backed with accurate information for you to make sound decisions. It becomes easier to implement a solid and operation-sensitive management plan.
2. Visual investors business report example
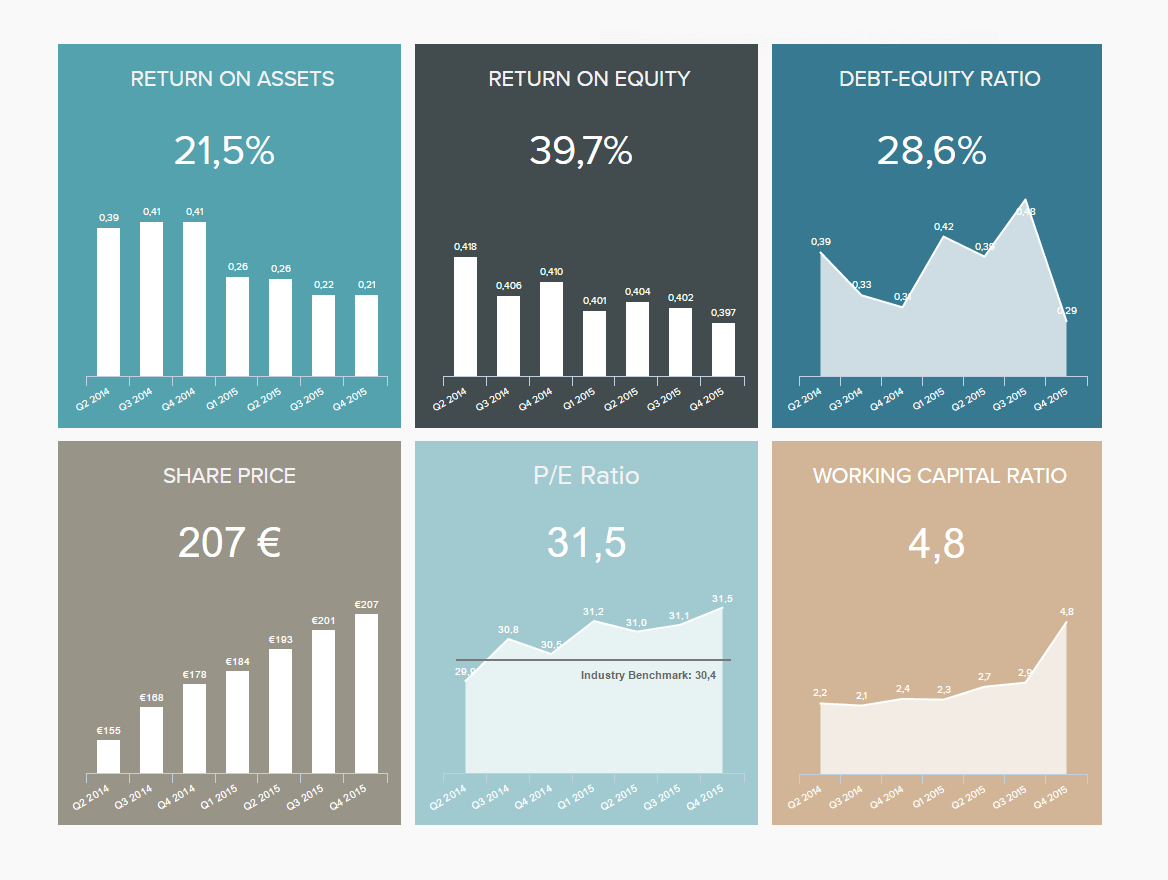
As mentioned earlier, holding an account of your activity, performance, and organization’s assets is important for people outside of the company to understand how it works. When these people are investors, it is all the more critical to have a clean and up-to-date report for them to know how successful is the company they invest in, and for you to increase your chances to have more funds. This example provides just that: an exact overview of the most important insights and specific values in a particular time frame.
**click to enlarge**
Calculating and communicating KPIs about the overall company situation is what this investors’ relationship dashboard tries to focus on. You learn about the return on equity and return on asset, the debt-equity ratio, and the working capital ratio, but also see the evolution of a share price over time. Each of these metrics is crucial for a potential shareholder, and if they are not monitored on a regular basis and kept under control, it is easy to lose investors’ interest. Tracking them and visualizing them through a modern dashboard is a competitive advantage for your investors’ reports. You can even see on this visual a clear set of data, so you don’t have to dig through numerous amounts of spreadsheets, but clearly see the specific development over time, the percentage gained or lost, ratios, and returns on investments. Not to be limited just to these data, you can always customize and make sample business reports for your specific needs.
3. Visual management business report example
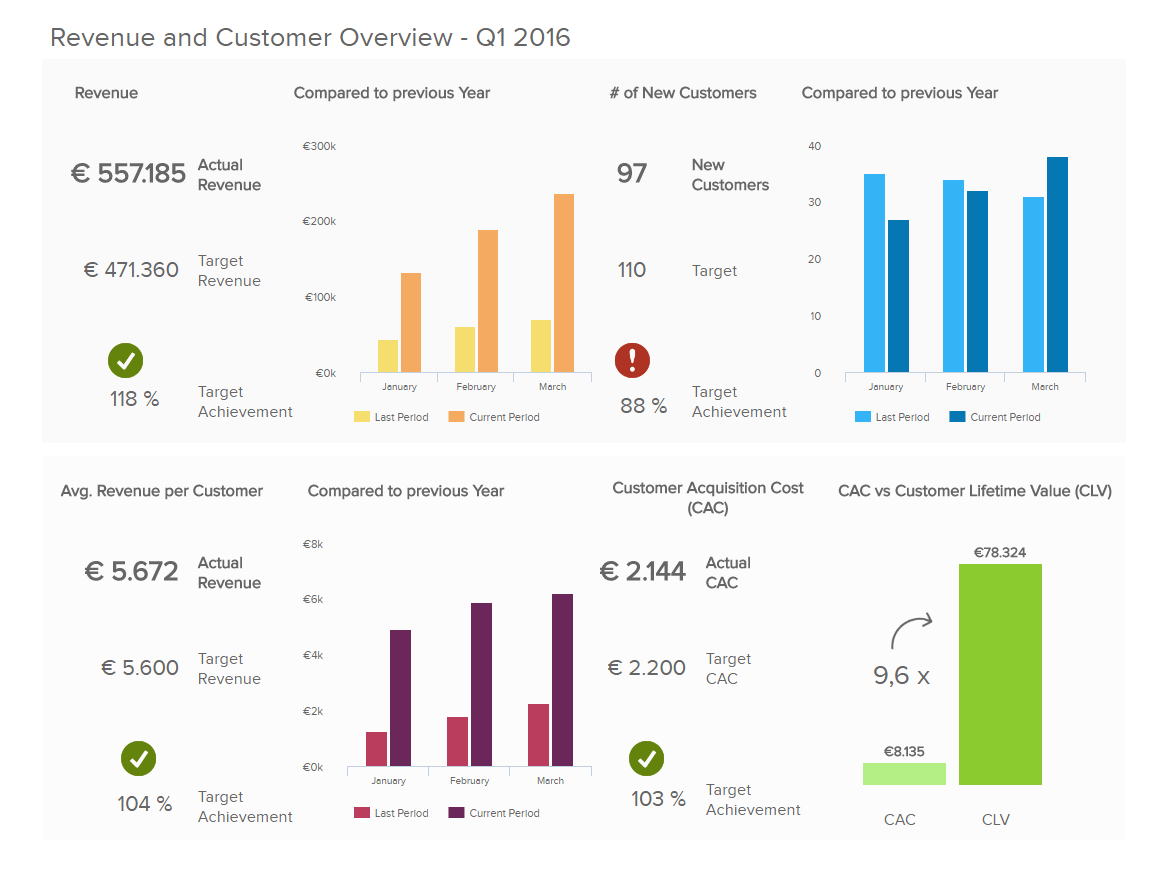
The management KPIs presented below focus on the revenue and customer overview seen through a specified quarter of a year. With just a click you can easily change your specific date range and make an overview of different months or years.
**click to enlarge**
When analyzing insights on a more specific level, you can easily spot if the revenue is approaching your target value, compare it to the previous year and see how much of the target you still need to work on. The average number of your revenue per customer compared to your targets can also identify on a more specific level how much you need to adjust your strategy based on your customers’ value. If you see your values have exceeded your goals, you can concentrate on KPIs that haven’t yet reached your target achievement. In this specific example, we have gained insights into how to present your management data, compare them, and evaluate your findings to make better decisions.
This clear overview of data can set apart the success of your management strategy since it is not possible to omit vital information. By gathering all your findings into a single CEO dashboard, the information presented is clear and specific to the management’s needs. The best part of this example report is seen through its interactivity: the more you click, the more data you can present, and the more specific conclusions you can look for.
These report templates that we have analyzed and presented in this article can be a roadmap to effectively create your own report, or customize your own data to tailor your needs and findings.
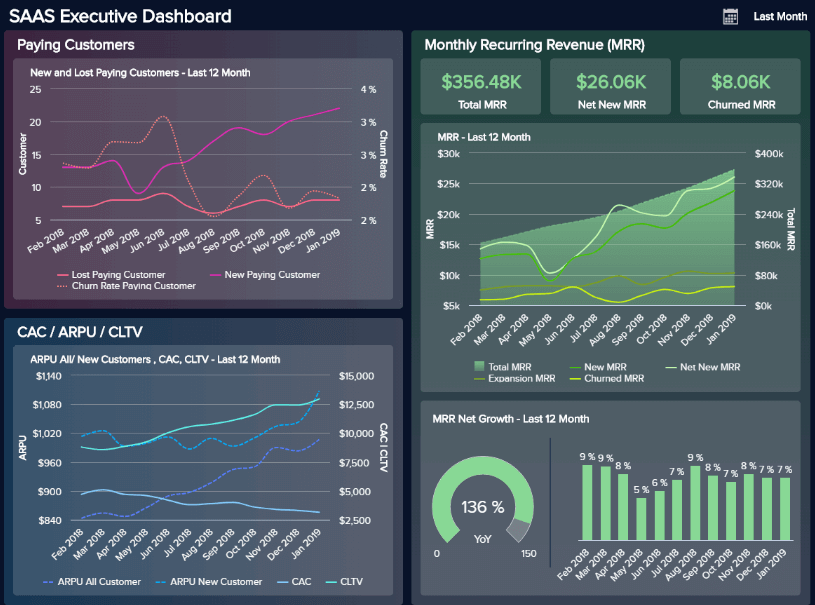
4. SaaS management dashboard
The next in our rundown of dynamic business report examples comes in the form of our specialized SaaS metrics dashboard.
**click to enlarge**
A SaaS company report example that packs a real informational punch, this particular report format offers a panoramic snapshot of the insights and information every ambitious software-as-a-service business needs to succeed.
With visual KPIs that include customer acquisition costs, customer lifetime value, MMR, and APRU, here, you will find everything you need to streamline your company’s initiatives at a glance. This is an essential tool for both short- and long-term evolution.
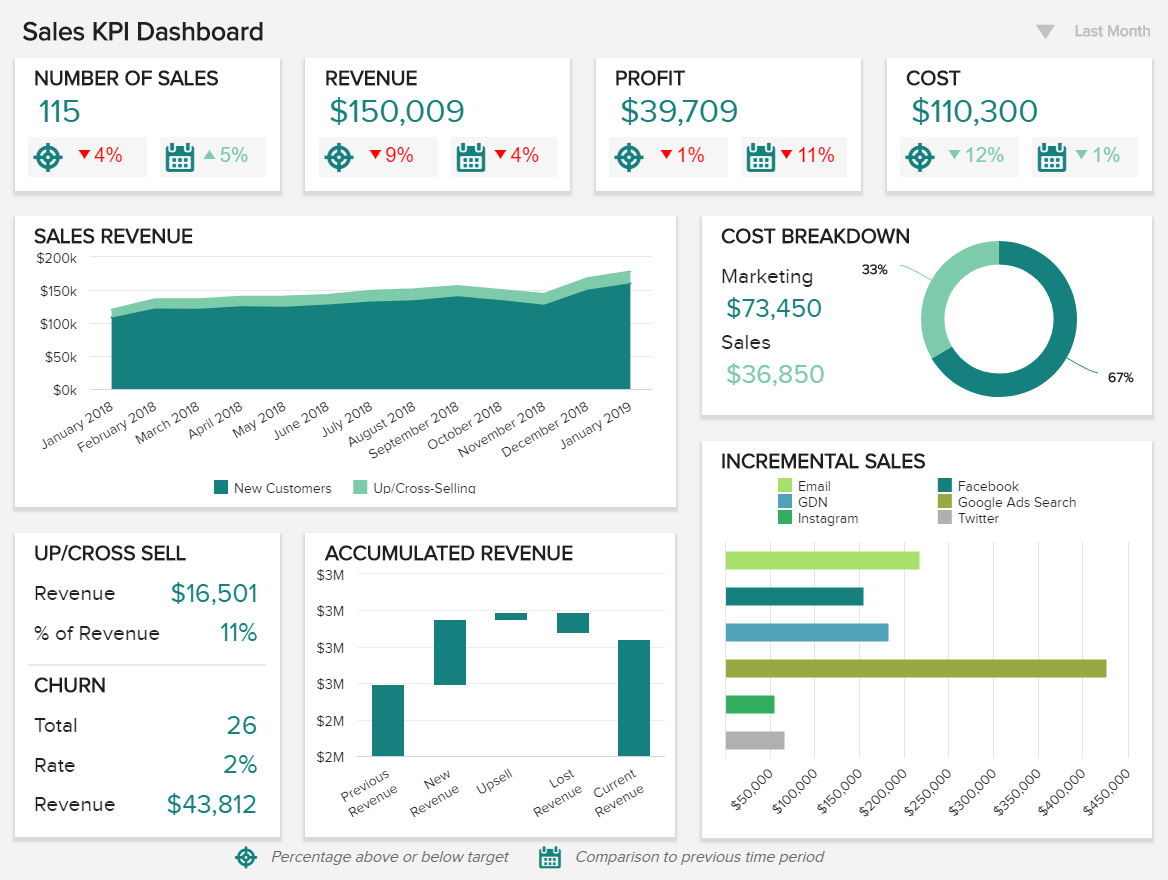
5. Sales KPI dashboard
Niche or sector aside, this most powerful of business reports samples will empower your sales team to improve productivity while increasing revenue on a sustainable basis.
**click to enlarge**
A powerful daily business activity report as well as a tool for long-term growth, our sales dashboard boasts a cohesive mix of visualizations built to boost your business’s bottom line.
With centralized access to sales graphs and charts based on churn rates, revenue per sales rep, upselling & cross-selling, and more, this is a company report format that will help you push yourself ahead of the pack (and stay there). It’s a must-have tool for any modern sales team.
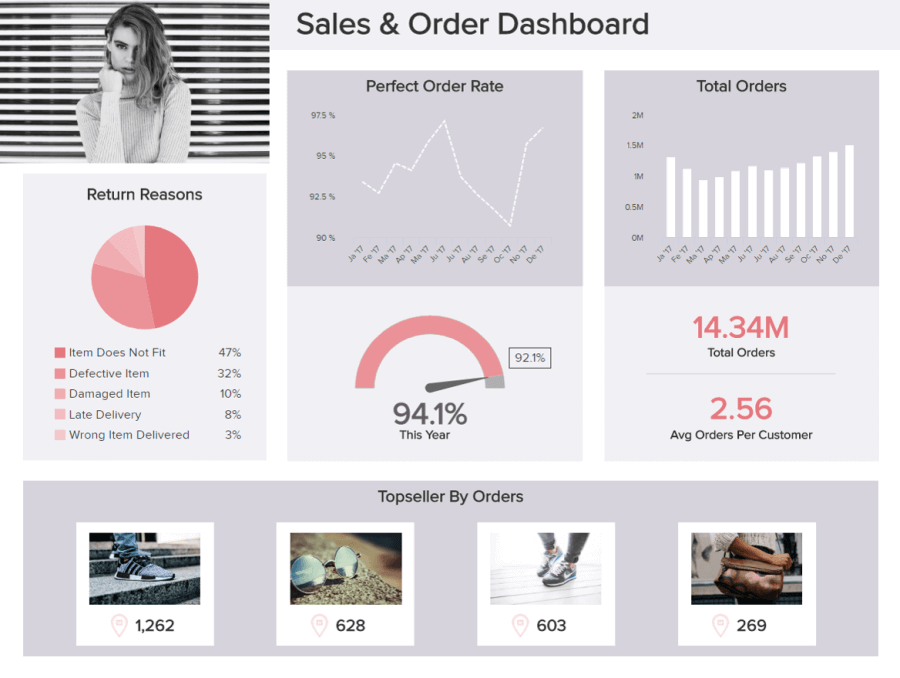
6. Retail store dashboard company report example
Retail is another sector where it pays to utilize your data to its full advantage. Whatever branch of retail you work in, knowing how to write a business report example is crucial, as is knowing which types of reports to work with.
**click to enlarge**
Our interactive retail dashboard is one of our finest visual report examples, as it offers a digestible window of insight into the retail-centric unit as well as transaction-based information that can help you reduce costs while boosting your sales figures over time.
Ideal for target setting and benchmarking as well as strategy formulation, this is an unrivaled tool for any retailer navigating their activities in our fast-paced digital age. If you’re a retailer looking for steady, positive growth, squeezing every last drop of value from your retail metrics is essential—and this dashboard will get you there.
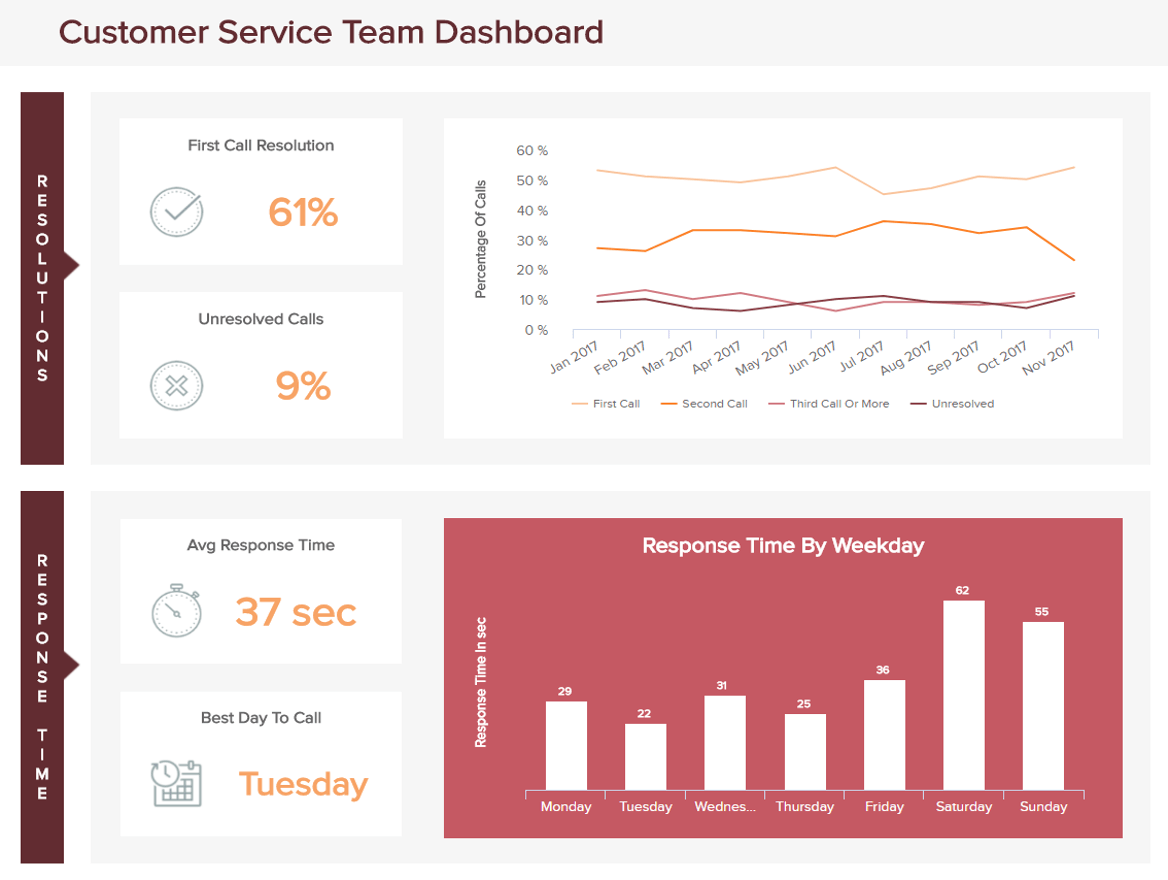
7. Customer service team dashboard
As a key aspect of any successful organizational strategy, optimizing your customer service communications across channels is essential. That’s where our customer service analytics report comes into play.
**click to enlarge**
Making your customer service efforts more efficient, effective, and responsive will not only drastically improve your consumer loyalty rates but also set you apart from your competitors.
One of the best ways to achieve a mean, lean, well-oiled consumer-facing machine is by giving your customer service representatives the tools to perform to the best of their abilities at all times. Armed with a balanced mix of KPIs to track and enhance service performance, this most powerful of business report samples will help you drive down response times while improving your first call resolution rates. It’s a combination that will result in ongoing growth and success.
8. Employee performance dashboard
In addition to your customers, your employees are the beating heart of your organization. Our employee dashboard will give you the power to track the ongoing value and productivity of your internal talent.
**click to enlarge**
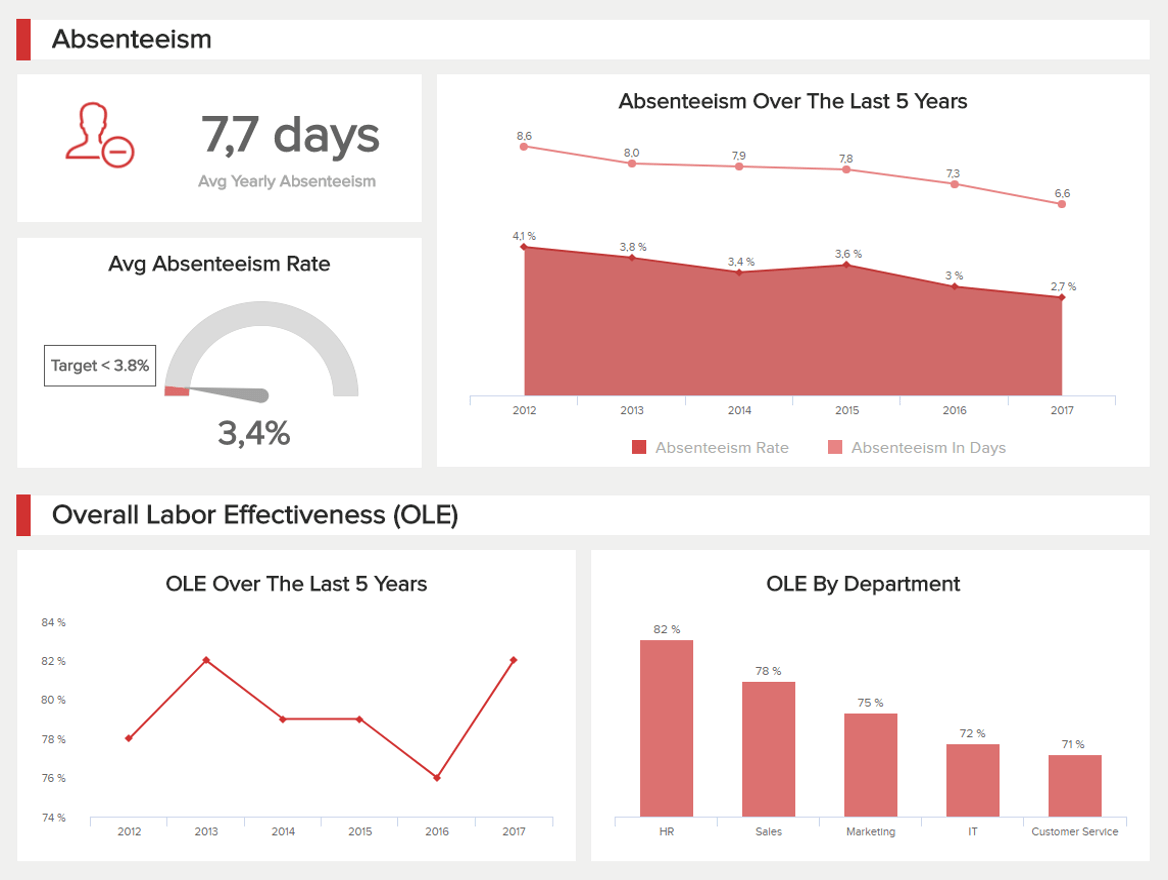
An ideal business report example for any modern HR department, this telling dashboard will give you a deep-dive insight into how your employees perform and behave over specific timeframes.
Here, you can examine trends in absenteeism rates, track overtime hours by age group, monitor your training costs, and explore peaks and troughs in productivity across the entire workforce. This melting pot of at-a-glance information will empower you to provide training exactly where it’s needed and get to the heart of any issue that’s affecting productivity or engagement levels.
Working with this business report format consistently will ultimately ensure you get the very best return on investment (ROI) from your internal talent.
9. Marketing KPI dashboard
Without a solid multichannel marketing strategy, it’s unlikely that you’ll ever see a consistently healthy ROI from your promotional efforts. Shooting in the dark when it comes to marketing will also see you fall behind the competition. Enter our marketing dashboard.
**click to enlarge**
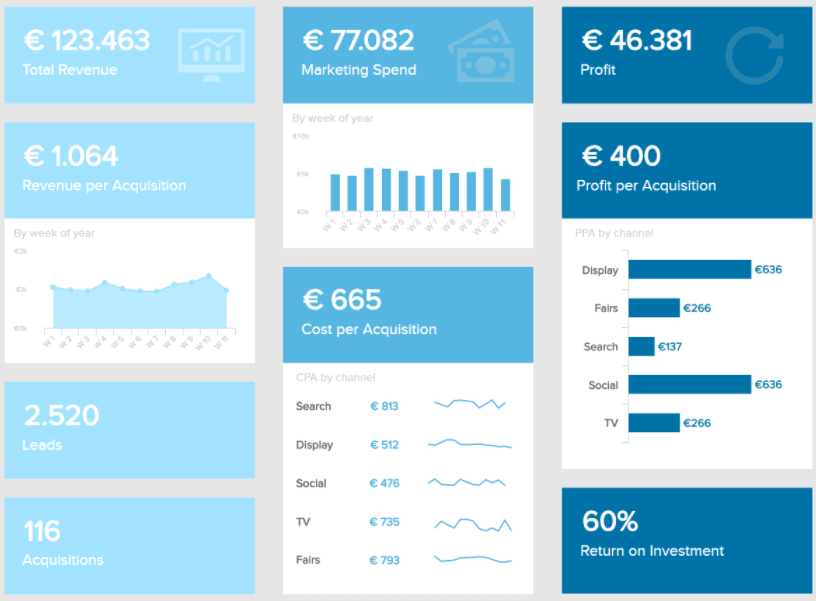
This business report template brimming with insight lets you set accurate performance benchmarks while uncovering a wealth of insight from one intuitive dashboard.
To optimize your promotional campaigns and activities, talking to specific segments of your audience using the right touchpoints at precisely the right time is essential. Without a targeted approach, all you’re doing is throwing your time and money away.
This effective company report example offers a balanced overview of your campaigns’ performance by offering the tools to dig deep into vital metrics like cost per acquisition (CPA), customer lifetime value (CLTV), and ROI.
This perfect storm of metrics will show you where your communications or campaigns are failing to drive engagement and where they’re yielding positive results. Armed with this critical information, you can optimize all of your efforts to make the biggest possible impact across channels. An essential business report design for any modern organization looking to scale swiftly and consistently.
10. Warehouse KPI dashboard
Being a warehouse manager or decision-maker is a high-pressure job where every decision counts. To keep your fulfillment activities and initiatives fluid, functional, and primed for organizational growth, sweating your data the right way is a must.
**click to enlarge**
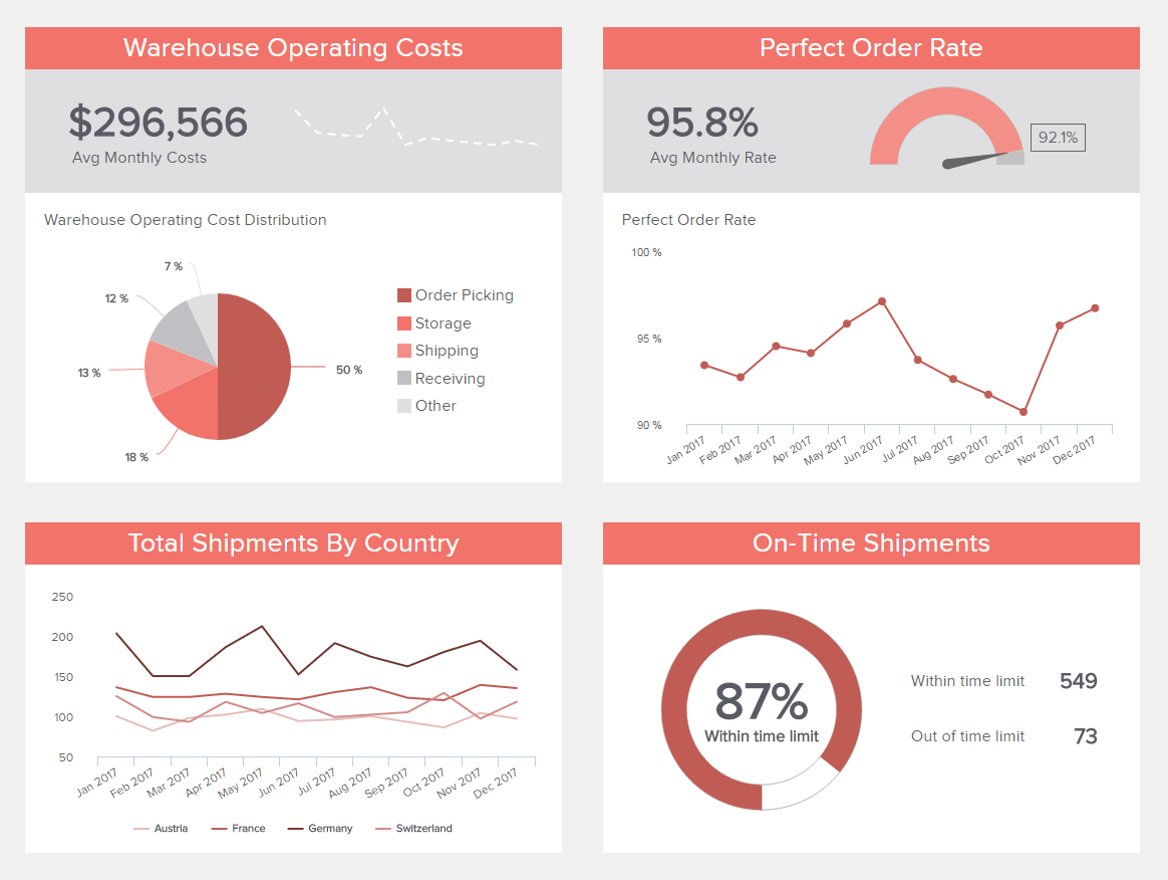
Our warehouse KPI dashboard is a business report sample that aids both real-time decision-making and longer-term strategic planning.
With a powerful selection of logistics-based KPIs, this highly-visual business report structure features metrics based on on-time shipment rates, a breakdown of warehouse costs, the number of shipments made over a specified timeframe, and a perfect order rate.
By making this kind of business reports formats a core part of your daily operations, you can eliminate unnecessary costs or activities while boosting overall productivity and significantly improving the success, as well as accuracy, of your warehouse operations. An invaluable tool that will help consistently deliver on your fulfillment promises, improving your brand reputation in the process.
11. Cybersecurity dashboard
In our hyper-connected digital age, failing to invest in adequate cybersecurity solutions is the same as leaving your front door wide open when you’re on holiday.
**click to enlarge**
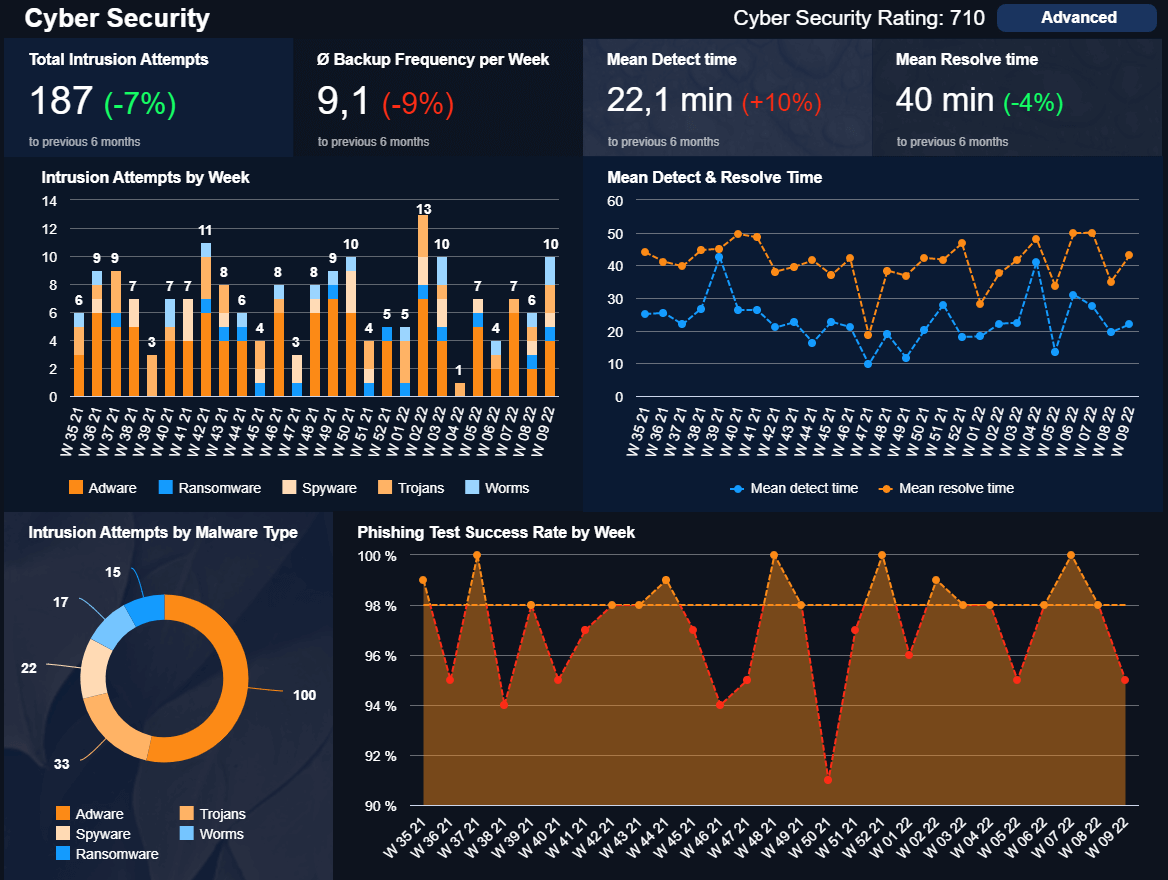
To avoid the devastating impact of organizational cyber attacks or informational breaches, our cyber security IT dashboard will ensure your company is fortified from every angle. This most vital of business report examples will help you fend off any prospective acts of cybercrime while monitoring for any attacks or abnormalities in real-time.
Here you can keep on top of your cybersecurity rating, track your phishing test success rates, understand how long it takes you to identify an attack (and improve your responsivity), look at how often you backup your company’s sensitive information, and discover the most common intrusion rates related to your company from a cohesive space. It’s an essential analysis tool designed to keep your company safe, secure, and happy.
Now that we’ve looked at report samples, let’s consider the clear-cut business-boosting benefits of these essential analytical tools. These are perks that will make your company stronger, more fluent, and more efficient on a sustainable basis.
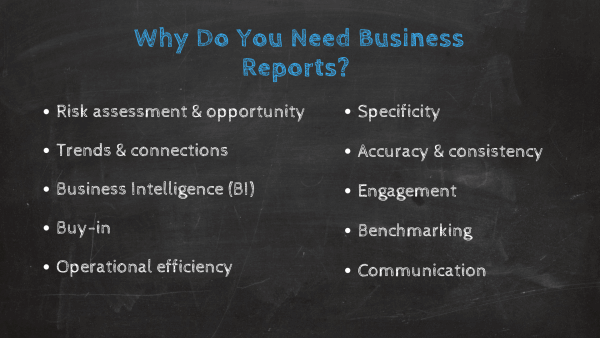
Why Do You Need Business Reports?
These reports also enable data collection by documenting the progress you make. Through them, you have the means to compare different periods of time and activity, growth, etc. You can better see which products or services are more successful than others, which marketing campaign outperforms which other, and which markets or segments require more attention. Collecting all this data is indispensable – and by doing so, you build a paper trail of your past (or, namely, a data trail). They let people outside the company (like banks or investors) know about your activity and performance and enable stakeholders to understand your organization’s tangible and intangible assets.
Risk assessment & opportunity: With business reports samples, you can increase the understanding of risks and opportunities within your company. Sample reports accentuate the link between financial and non-financial performance: they streamline processes, reduce costs, and improve overall cohesion in an informed, commercially ‘safe’ way.
Trends & connections: Business report samples can help you compare your performance to other internal units or companies in the same sector. On a more specific level, a report template can help you dig thoroughly into operational metrics, and details, and discover correlations that would be otherwise overlooked. In today’s hyper-connected digital age, gaining a deeper insight into your data will empower you to formulate strategies that will accelerate key areas of your business growth through trend identification. This fact alone highlights the importance of a business analysis report.
Business intelligence (BI): If used correctly, the best BI tools will provide the answer to a vital question: ‘Will I survive on the market?’ By creating a business report of a company built to improve your BI activities and answer essential organizational questions, you will gain the ability to tackle deeper specific insights that can bring operational value and control the overall expenditures. By knowing how to set up such a report with specific samples and templates, you will be able to provide building blocks to establish a successful business intelligence strategy.
Buy-in: While there are many different types of business reports for a company, they all have one common trait: gathering data and tracking the business activities related to something specific. By working with the right reports, users can perform in-depth visual analyses of many key areas or functions and provide informed recommendations that will ultimately improve efficiency and encourage innovation. Regardless of how good or beneficial an idea might be, getting buy-in from senior executives or external partners is often a major roadblock to progress. However, a good report template presents a level of depth and presentation that is both factual, and convincing, and will encourage buy-in from the people with the power to sign off on new strategies, initiatives, or ideas.
Operational efficiency: The more factual the report is, the clearer the data. When your data is well organized and crystal clear, it’s possible to interpret your business activities in a cost-effective way, reducing the time required to analyze findings while saving countless working hours sifting through metrics for actionable insights. A good template for business reports presents an in-depth analysis where the writers show how they have interpreted their findings. For example, a marketing report can reduce the time needed to analyze a specific campaign, while an HR report can provide insights into the recruiting process and evaluate, for example, why did the cost per hire increase?
Specificity: When you create a business report, you are giving yourself a key opportunity to address specific issues which are often used when decisions need to be made. As author Alan Thomson says, “a company report conveys information to assist in business decision-making. [It] is the medium in which to present this information.” They have several purposes: some record information to plan for the future, some record past information to understand a situation, and others present a solution to a pressing problem. Some executive dashboards are for daily usage, while a monthly business report template will help you pinpoint your activities on a more gradual, incremental basis. They all are essential to commercial success, as they bring clarity to complex analysis. As mentioned earlier, the clearer the data, the more cost-effective results will be, so keeping in mind the exact data to incorporate into this kind of report should be essential in deciding what kind of report to generate. You can find multiple key performance indicator examples in different industries, which should be considered when creating that kind of report. You can also generate an interdepartmental report or between businesses to compare industry values and see how your company stands in the market.
Accuracy & consistency: In The Age of Information, data is a vast landscape, and if you want to use it to your advantage, aiming for consistency as well as accuracy is key. If your data is off or presents findings that are hit-and-miss, it could cost your company in the long run. Working with an online dashboard tool to produce your reports is an incredible advantage for the ease of use, the time saved and most importantly, the accuracy of the information you will use. As you work with real-time data, everything on your report will be up-to-date and the decisions you will take will be backed with the latest info. Business reporting examples are significantly helpful when you need to explore your data and perform data analyses to extract actionable insights. They will deliver an important added value to your report thanks to the visualization of your findings, bringing more clarity and comprehension to the analyses, which is their primary purpose.
Engagement: As intuitive, digestible, and visual tools, business-centric reporting tools are easier to understand and tell a story that is far more likely to resonate with your audience. While exploring your data, with deeper insights generated with just a few clicks, the report doesn’t have to be dull, boring, and lost in hundreds of pages or spreadsheets of data. If you create a report that is clean and customized, you will bring more value than by printing or searching through a spreadsheet. Achieving a design like this is simple with the right KPI dashboard software. Imagine yourself in a meeting, with 200 pages of analysis from the last 5 years of business management. One participant asks you a specific question regarding your operational costs dating 3 years back. And you’re sitting there, trying to find that specific piece of information that can make or break your business meeting. With business dashboards, you cannot go wrong, all the information you need is generated with a click, within a click, within a click.
Benchmarking: If you know how to set up a business-centric report with efficiency, you will gain the ability to set defined, accurate benchmarks. By frequently setting targets based on your most important organizational goals and working with visual reporting tools, you will keep your organization flowing while catalyzing your overall growth and productivity levels.
Communication: One of the best uses of business reports is improving internal collaboration and communication. By gaining 24/7 access to your most essential business data while enhancing the way you analyze and present it, you will empower everyone in the business with better access to information, which, in turn, will enhance internal communication and collaboration.
Innovation: The intuitive nature of these reports makes them the most efficient way to steer a progressive analytical strategy. As such, it’s easier (and quicker) to uncover hidden insights, spot trends, and hone in on critical information. It’s this speed, ease, and accuracy that frees creativity and improves innovation across the organization, accelerating growth as a result.
These reports can also be of many different types, but they all have one common trait: gathering data and tracking the organizational activities related to something specific. From there, their author(s) will often perform an analysis and provide recommendations to the organizations.
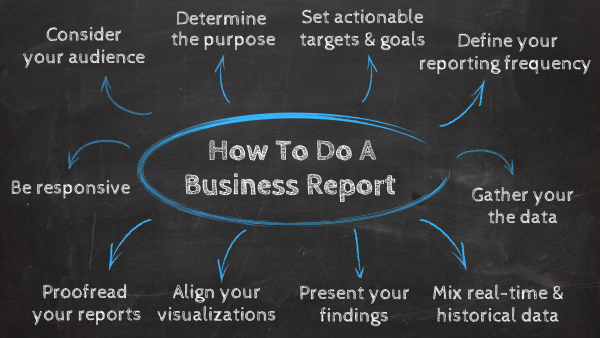
How to do a Business Report
The primary importance of a corporate-centric report lies in gaining confidence and clarity. Before starting to create your report, it’s vital to establish the goals and the audience. Knowing who you want to direct it to is key in its elaboration, from the tone, vocabulary/jargon you choose to the data you will focus on. A report to external stakeholders, to the CEOs, or to the technical engineers’ team will be drastically different from one another.
Likewise, the scope varies according to the objective of the report. State beforehand the needs and goals, to direct you on the right path. It should be impartial, and objective, with a planned presentation or dashboard reporting tool which enables an interactive flow of data and immediate access to every piece of information needed to generate clear findings.
To help you write your daily, weekly, or monthly business-centric report template with confidence, let’s go over some essential steps and tips you should focus on:
1. Consider your audience
First of all, if you want to understand how to do a business report the right way, you have to think of your audience from the outset. Your reporting efforts must make sense and offer direct value to the end viewer or user – otherwise, they’ll be meaningless. That said, it’s critical that you take the time to consider who will use the reporting tool most and which information or features will add the most value, helping improve the organization in the process. Take the time to understand your audience, and your reporting tools will not only meet expectations but exceed them – one well-placed visualization at a time.
2. Determine and state the purpose
As we stated in the previous paragraph, defining the needs of your audience is vital to reporting success. As we said, a report usually assists in decision-making and addresses certain issues. You can state them at the beginning of the report. The more clear and specific the goal, the better the content will be. You won’t lose time adjusting information when you present your purpose in a clear and well-defined manner.
3. Use a mix of real-time and historical data
Another key component of business reporting is making sure you’re free of any informational blind spots. So many companies work with one form of metric, stunting their organizational progress in the process. To drill down deep into detailed pockets of information and gain a panoramic view of specific trends or patterns, working with a balanced mix of historical and real-time data is key. Doing so will empower you to capitalize on potential strengths while learning from historical weaknesses. This balanced approach will also give you the tools to develop strategies that return the best possible ROI while making powerful decisions under pressure.
4. Set actionable targets and goals
Once you’ve curated your informational sources and defined your audience, you should set actionable goals. Setting the right benchmarks will help you track your ongoing success with pinpoint accuracy while defining goals or targets will give you the insight you need to work with the right KPIs while ensuring your company is moving in the right direction. Taking the time to set actionable goals and targets that align with your organizational strategy will ensure your reports offer a consistently healthy ROI.
5. Define your reporting frequency
Another key component of successful organizational reporting is deciding how often you’re going to analyze your metrics and information. Depending on the function or the goals you’re looking to achieve, you should decide whether your dashboard will serve as a daily, weekly, monthly, or quarterly reporting tool. Setting the right frequency will ensure your analytical strategy is fully streamlined while connecting you with the insights that count most at exactly the right time. The best modern reporting tools also offer automated functionality, helping to monitor insights and offer alerts without human intervention – the best way to save time while making sure you never miss a critical piece of information again.
6. Gather and organize the information
Now that the purpose and scope are clearly defined, you can start gathering the data under any form needed that can address the issue. Thanks to that information you will carry out data analysis to understand what lies beneath and to extract valuable insights. These findings need to be balanced and justifiable – what significance they have to the purpose of the report. Identifying key performance indicators for a specific company, organizing, comparing, and evaluating them on the needed level, can be one of the most important parts of creating this kind of report. An example of a business report that shows how to extract and define your analysis can be found above in the article, where we presented our visuals.
7. Present your findings
Explain how you uncovered them, and how you interpreted them that way. Answer the original issue by detailing the action to take to overcome it, and provide recommendations leading to a better decision-making process. A best practice to present the insights you have drawn out is the use of dashboards that communicate data visually in a very efficient way. A dashboard software like datapine can precisely answer that need, while at the same time helping you with data exploration, which is a crucial part. When you click on a specific part of the dashboard, you can easily access your data in a more in-depth approach.
Comparing your findings is also one of the features you can use if you are asking yourself what has changed in relation to a specific period. When you assess these datasets in just a few clicks on your monitor, the whole reporting process, and measurement of your strategy can be done in minutes, not days. Evaluating findings in today’s digital world has become one of the main focuses of businesses wanting to stay competitive in the market. The faster you can do that, the more information you gain, and the more successful your actions will become.
8. Align your visualizations
Expanding on presenting your findings, it’s also important to get your design elements right when considering how to write a business report. As a rule of thumb, your most essential at-a-glance insights should be at the top of your dashboard, and you should aim to be as clean, concise, and minimal as possible with your presentation to avoid cluttering or confusion. To improve your visual storytelling and bring every key element of your report together cohesively, getting your dashboard design just right is vital. Our essential guide to data visualization methods will help to steer your efforts in the right direction.
9. Proofread your reports
When you’re looking at a polished example of a business report, you’ll notice that every element of design and content is immaculate and makes complete logical sense. That said, to get the best returns for your analytical efforts, proofreading your reports is vital. Work through your report with a fine tooth comb and ask trusted colleagues in your organization to do the same. Once you’ve carefully proofread your entire report, you can collectively tighten up any sloppy design elements, typos, misleading copy, and bad visual placements. Doing so is vital because it will make your examples of business reports slick, actionable, accurate, and built for success.
10. Be responsive
While modern reporting dashboards are dynamic and interactive in equal measure, it’s important that you also remain robust and responsive when writing a business-based report. What does this mean, exactly? It means that in the digital age, the landscape is always changing. As such, if you want to get the most from your reports or dashboards, you must commit to editing and updating them according to the changes around you. In an informational context, what is relevant today may be redundant tomorrow, so to remain powerful and relevant, your reports must always be optimized for success. When you write a business-style report, you should understand that, to some extent, you will need to rewrite it again and again. Keep this in mind, commit to regularly assessing your reports, and success will be yours for the taking.
You can easily find a sample of a business report on the Internet, but not all of them fit your needs. Make sure, at any moment, that the report you want to create is accurate, objective, and complete. It should be well-written, in a way that holds the reader’s attention and meets their expectations, with a clear structure.
Key Takeaways Professional Business Reports
“Once we know something, we find it hard to imagine what it was like not to know it.” – Chip & Dan Heath, Authors of Made to Stick, Switch
We live in a data-driven world, and as a business, it’s up to you to move with the times. If you ignore the power of smart data analytics, you are only stunting your own commercial progress.
We’ve explored many shining business reports examples and one thing is abundantly clear: if you embrace the power of digital reporting, your company will be bigger, better, and exponentially more informed. The more confident and informed you are as a business, the better you will be able to respond to constant change. In today’s digital world, it doesn’t matter what sector you work in. If you’re rigid in your approach to data, you will get left behind. Digital reporting dashboards are the only way forward.
So, you now know what are business reports, how to structure and write them, and how they can benefit your business. Committing to the right reporting and information delivery can have a significant impact on your organization and orientate its strategy better. For more ideas about business reporting in a more specific, function-related way, you can dig deeper into some of our popular articles on sales reports and marketing reports!
Don’t miss out on that opportunity and start now with datapine’s online reporting software, and benefit from a free 14-day trial! You won’t regret it.