


In today’s business world, the competition is fierce. Sector, niche, or industry aside, to survive and thrive in an ever-evolving digital landscape, working with measurable online data analysis and performance metrics is essential.
To succeed in the Age of Information, you have to keep your internal talent as well as your clients happy. In fact, customer experience (CX) is one of the main brand differentiators across industries, surpassing factors like price and product in terms of importance to today’s digitally native consumers.
By choosing a dynamic mix of KPI examples to track, measure, and forecast the success of your company’s client-facing activities, you will set yourself apart from the competition in a big way.
Working with proper help and service desk metrics and KPI reports will allow you to make the improvements you need for continual growth and success.
To put this notion into perspective, we’re going to explore the value of help desk metrics, and consider a mix of real-world service KPI reports.
Let’s get started.
What Is a Help Desk KPI?
A help desk KPI (or service desk KPI) is a performance metric centered on your business’s customer service and support activities. These KPIs include first response times, issue resolution rates, satisfaction levels, and other important consumer-facing metrics.
As the saying goes: what gets measured can be improved. Your customer service operations are no exception.
By gaining this level of insight, it’s possible to spot trends, capitalize on strengths, identify weaknesses, and become more cohesive, consistent, successful, and intelligent as an organization.
As mentioned, customer experience is pivotal to commercial success and evolution in the digital age, and by working with help desk metrics and online data visualization, you stand to push yourself ahead of the pack, one insight at a time.
A service desk KPI drills down into the areas relating to clients’ issues and requests from various forms of media including phone, web chat, or email. These operational metrics measure the success of your operations. For a service desk to remain successful, communication is key.
The primary role of a help desk is to make sure that end-users (clients, consumers, and business partners) receive appropriate help with their issues, requests, and questions in a smooth, timely manner.
Service desk reporting metrics and key performance indicators are designed to assist in the continued growth, success, and improvement of your business’s consumer-facing efforts. Help desk metrics will enable you to make every one of your customer service touchpoints the best they can be.
Why Are Help Desk & Service Desk KPIs Important?
Service desk metrics and key performance indicators are incredibly powerful and will allow you to improve your business, encouraging customer loyalty and boosting your bottom line in the process.
Without benchmarking your performance effectively while setting targets and giving your data direction, you will only ever reach half of your business’s customer support potential.
In addition to these clear-cut benefits of using service desk KPIs, here are a few other reasons why tracking these metrics is vital to the ongoing success of your business:
- Clarity: You’ll gain a clear understanding of where you need to focus your efforts to improve your service performance. For instance, if some of your agents are underperforming, you’ll be able to gain a deeper understanding of why that is and be ready to take the right approach by offering training, support, and motivation. This, in turn, will boost your customer satisfaction metrics.
- Accountability: A KPI for service desk will help make people more accountable for their performance, responsibilities, and duties in several key client-facing areas. If the data is presented in a clear, digestible format, such as a customer service report, the proof will indeed be in the pudding. This means that everyone in your business will need to accept accountability for their actions, making your organization stronger and more productive. Being accountable for one’s actions usually boosts engagement. If you use data to help your staff become more accountable, you can provide them with more autonomy, which will further drive their performance.
- Engagement: By obtaining access to a panoramic snapshot of your business’s entire support processes, you’ll be able to make vital improvements to your service levels, consumer touchpoints, content, and communications. In doing so, you stand to significantly improve your engagement levels, which will positively impact your brand authority and overall consumer-facing performance levels.
- Loyalty: In this context, KPI-driven loyalty works on two levels: customer loyalty and staff loyalty. Simply put, if your support staff are happy, motivated, and engaged, they will be more loyal and perform better; and if your customers are satisfied with the assistance you offer them, your chances of repeat customers will improve exponentially.
- Innovation: Service desk KPI reports offer a level of vision and data-driven insight that will empower you to streamline all of your consumer support processes sustainably. By utilizing an online reporting tool, you will ensure maximum efficiency and become more adaptable to change while gaining time to focus on creative initiatives. In turn, help desk KPI metrics will improve your brand reputation while pushing you ahead of the pack.
“A brand for a company is like a reputation for a person. You earn reputation by trying to do hard things well.” – Jeff Bezos
Top 15 Help Desk KPI Examples
Now that we’ve established the power and business-enhancing potential of these metrics, it’s time to explore some real-life examples. These are the help desk KPIs you need to track for the best possible customer data management and service-driven business performance.
Here, we look at 15 top metrics that will help you consistently meet your buyer’s needs, exceed expectations, and skyrocket your brand reputation.
1. Tickets by status
The first of our service desk KPI examples, tickets by status, is a must-track metric as it offers a clear-cut insight into the number of support tickets your business receives as well as the corresponding ticket status.
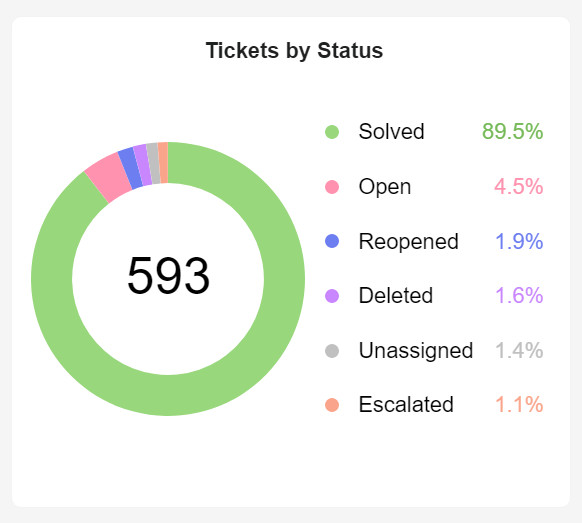
By monitoring your customer inquiry ticket statuses (new, open, pending, on-hold, solved, closed) on a regular basis, you’ll be able to track the overall performance and responsiveness of your customer service operations, giving you the opportunity to make vital improvements while offering the kind of internal assistance that will significantly boost your consumer satisfaction levels.
2. First response time
Your first response time (FRT) is essential as it measures the average time between the receipt of a consumer inquiry to the initial communication made by an agent.
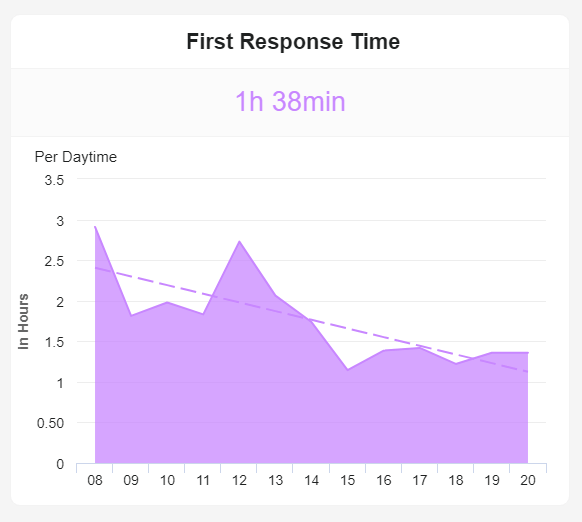
This help desk template has a significant impact on satisfaction and loyalty, so keeping your FRT as low as possible should be one of your business’s main consumer-facing priorities. This indicator will help you keep a visual log of your FRT over time, presenting a prime opportunity to consistently enhance your support strategy.
3. Top service agents
Disengaged team members cost US-based companies alone up to $550 billion a year. As mentioned earlier, supporting, engaging, and motivating your employees is integral to your organization’s ongoing service success.
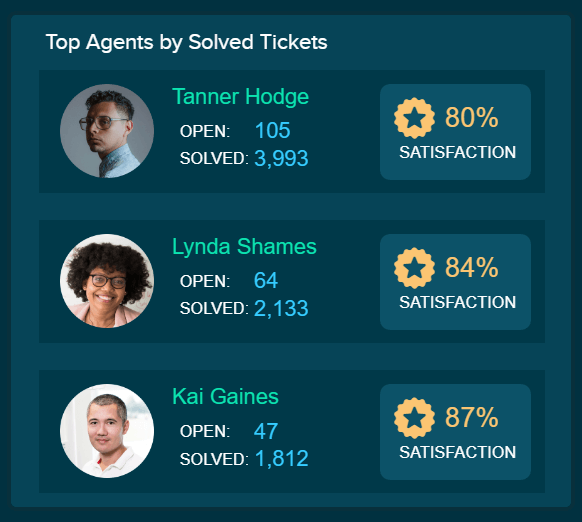
Presented in a leaderboard format, the top performing agents indicator offers a swift snapshot of the performance of individual members of your customer support team, allowing you to celebrate positive achievements, help those that need extra training, and as a result – make your service department the best it can possibly be.
4. Net Promoter Score
Your Net Promoter Score (NPS) is one of your most invaluable customer service metrics as it drills down into the likelihood of your consumers recommending your service to others. And as you might be aware, today’s consumers value the opinions of their peers above all else.
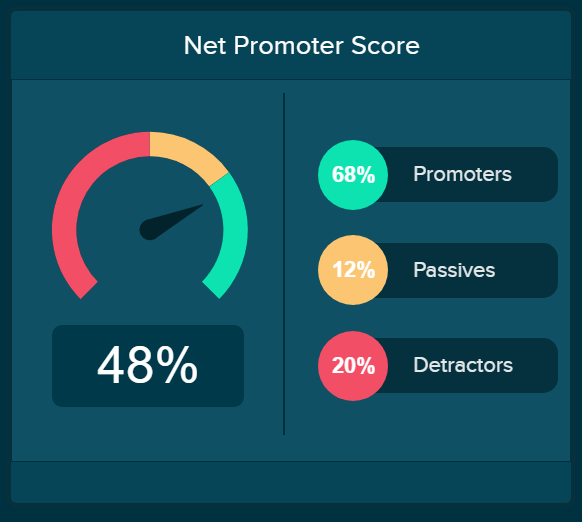
With this must-track service desk KPI, you can examine your number of ‘Promoters,’ ‘Passives,’ and ‘Detractors,’ look at your overall NPS score, and build strategies based on improving this metric, thus optimizing the overall performance of your customer service department.
NPS is an essential client-centric performance indicator that will help you preserve your brand reputation and ensure your business continues to adapt to meet the ever-changing needs of your consumers – a help desk metrics industry standard.
5. Utilization rate
One of the cornerstones of productive, cohesive, and attentive customer support is ensuring that every member of your team is working to their full potential. In addition to keeping your agents engaged and motivated, utilizing their strengths or reaching their productivity potential will transform your service offerings from average to exceptional.
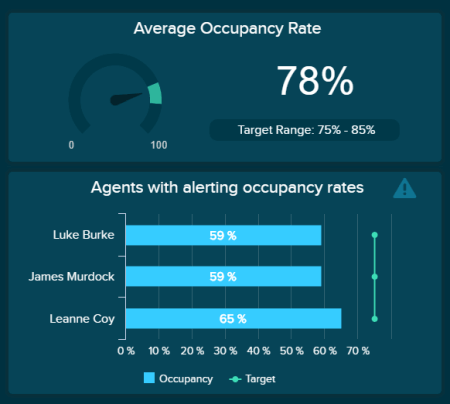
Also known as occupancy rate, this metric will help you monitor your whole support team’s workload with razor-sharp accuracy while drilling down into the output of individual staff members.
Presented in an accessible bar chart format, our utilization rate metric will give you a clear snapshot of what percentage of time your team spends on genuine support-centric tasks. If you spot a lag in utilization or support output, you will be able to get to the root of the issue swiftly, providing training or updating your strategy where necessary.
6. Customer satisfaction
When it comes to consumer support, here’s the bottom line: if your customers are unsatisfied with your service, you are doing something wrong, and you need to fix it.
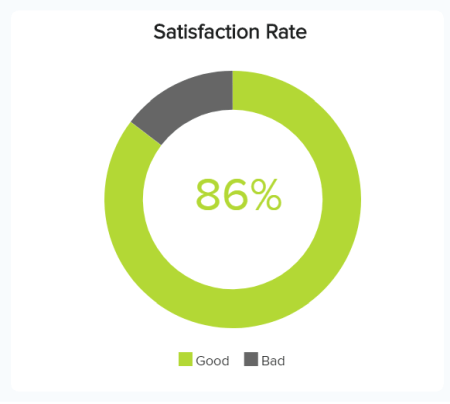
Our customer satisfaction indicator is particularly effective as it offers an at-a-glance overview of your customers’ overall satisfaction levels over a specific time frame.
Based on the customer satisfaction score (CSAT) metric, which is typically measured on a 1-5 scale, you can use this most essential of service desk performance metrics to gauge how your customers perceive your approach. This metric works most effectively alongside net promoter score (NPS) insights.
7. First contact resolution rate
A key component of any help desk metrics dashboard, your first contact resolution rate (FCR) shows the percentage of tickets that your team resolves at the initial point of contact.
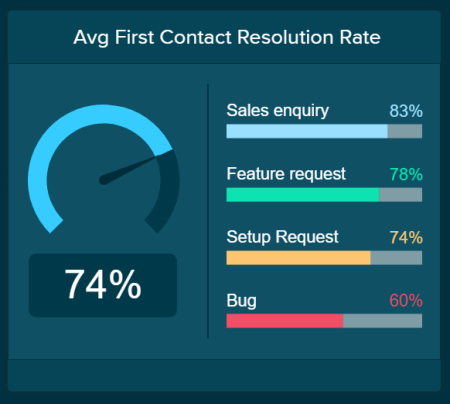
With so many channels and touchpoints to manage in the digital age, resolving your customers’ issues with as few steps or follow-ups as possible will significantly improve your efficiency and satisfaction levels.
By being able to easily analyze your first contact resolution based on different queries or issues, you can spot emerging trends and create informed strategies to increase your first contact success consistently.
8. Tickets by type
Knowing the nature of your ticket types and customer requests is essential to the ongoing success and development of your business’s support offerings.
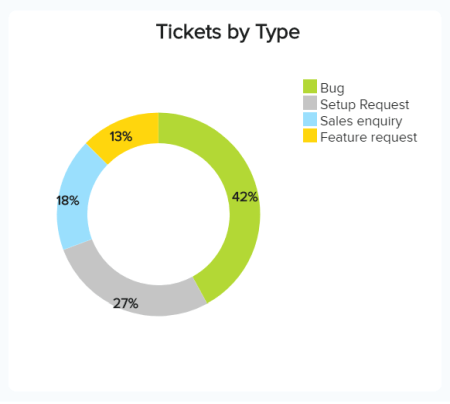
As one of our most useful service desk performance metrics, tickets by type provides a digestible visual snapshot of the main requests your agents deal with over a set period.
Request types and the nature of queries differ from business to business according to size, model, and sector. Still, by periodically tracking these support desk metrics, you will get an accurate overview of your most prominent query types, allowing you to prepare resources or strategies accordingly. In turn, this will increase output, improve your service levels, and ultimately, increase loyalty.
9. Tickets by channel
There is seemingly an infinite number of channels and touchpoints to manage in the digital age. By getting a solid grasp on every one of your main support channels, you will ensure the support you offer is personable, extensive, and fit for the modern age.
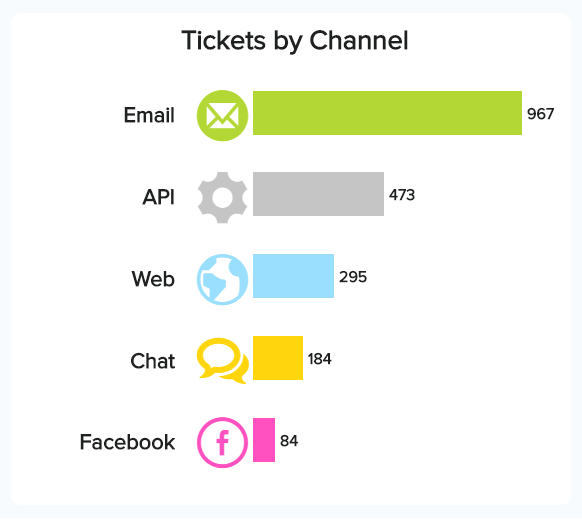
As one of our top help desk metrics, ticket by channel is a swift and effective way of understanding where the main source of your support queries comes from. It gives you a panoramic overview of how to distribute your efforts.
Using this digestible bar graph-style metric as a working guide, you can instantly see where the bulk of your tickets come from. You can then drill down further into each channel (allocating time and effort according to engagement levels) using a mix of the metrics discussed above – in particular, first response time and satisfaction levels.
By analyzing each channel, you can iron out any potential issues or inefficiencies and ensure a consistently high level of service across the board. This will accelerate the growth and success of your business.
10. Average resolution time
Next in our rundown of top help desk metrics and KPIs is average resolution time, also known as full resolution time.
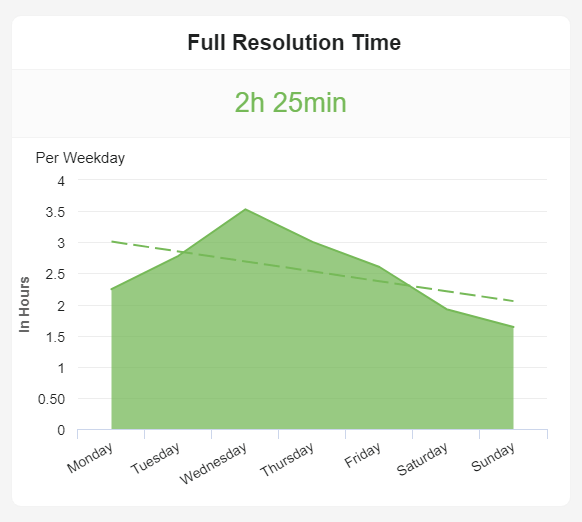
Generated with a professional KPI tool, this vital visualization will give you an accurate gauge of how long it takes, on average, for a request or query to reach a resolution from the time it’s raised, excluding non-operational or non-business hours. The quicker an agent can successfully wrap up a request, the better. So, if you notice a lag in your average resolution time, you can get to the heart of the issue and improve your processes (or provide training where it’s needed).
11. Cost per ticket
Cost per ticket is an essential service desk dashboard metric that will show you how much budget it takes, on average, to resolve a request.
By benchmarking this metric regularly, you will paint a vivid picture of how efficient your support agents and processes are while understanding which resources you use most to get the job done. Armed with this information, you can nip any issues in the bud while creating more cost-effective yet fluid processes across the board.
12. Repeat visits
The reason the repeated visits are so important is simple: if a customer or client keeps on finding their way to your service desk, it’s clear that their queries aren’t being resolved or their questions aren’t being answered.
If you find that your repeat visits are on the rise, you can take immediate action and put measures in place to improve your support resolution success rates. You might discover, for instance, that you need to provide more personalized training to your agents or that you need to make your communications more succinct. Whatever you uncover, your repeat visits metric will help you meet customer requests far more consistently.
13. Customer churn
In our hyper-connected digital age, a customer can connect with a competitor or cancel a subscription with the swipe of a screen or the click of a button.
That said, to reduce your churn rates and improve retention, tracking a help desk dashboard metric like customer churn is vital. When you track this key performance indicator regularly, your support agents and decision-makers will gain the information they need to understand where to place their service efforts while sharing content or communications that result in customer loyalty. This is essential in today’s cutthroat business environment (especially when you consider that retaining existing customers is more financially effective than attracting new ones).
14. Quality rate
To reach, or exceed, your performance goals, quality is key—and that’s what this most dynamic of service desk KPIs is all about.
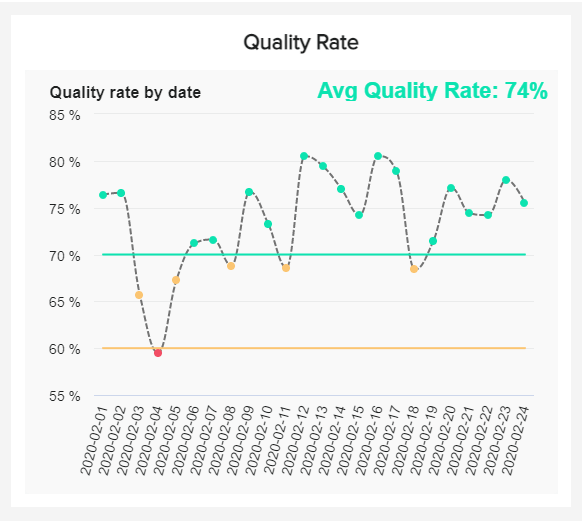
Based on the overall success and perception of your support center’s service, this dynamic metric will present trends, patterns, or numbers based on customer feedback. By asking them to rate the quality of their communications with your agents, you will quickly discover whether you’re consistently meeting your customers’ needs while maintaining a positive brand reputation.
If you do notice any discrepancies in your quality rates, you will be able to act with speed and precision before the issue snowballs.
15. Average answer time
The average answer time quantifies the speed at which a support agent answers a call from the time it’s activated in the system.
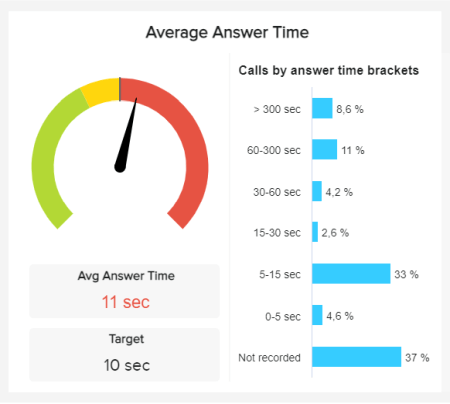
Broken down into digestible parameters based on seconds, this useful metric will paint a clear picture of your call system’s overall efficiency. If you notice a number of bounced calls or a trend in long answer or transfer times, you will have the information required to tweak your staffing strategy or provide on-call training to help your agents resolve queries with greater efficiency and ensure your call handling strategy is flowing, reducing answer times and boosting customer satisfaction in the process.
Here is a summary of the top 15 help desk KPIs and metrics that we discussed in detail:
- Tickets by status
- First response time
- Top support agents
- Net promoter score
- Utilization rate
- Customer satisfaction
- First contact resolution rate
- Tickets by type
- Tickets by channel
- Average resolution time
- Cost per ticket
- Repeat visits
- Customer churn
- Quality rate
- Average answer time
Bringing It All Together With Help Desk Dashboards
We’ve established just how invaluable working with the right help desk metrics dashboard is. Now, we’re going to explore two Zendesk dashboard examples that bring it all together.
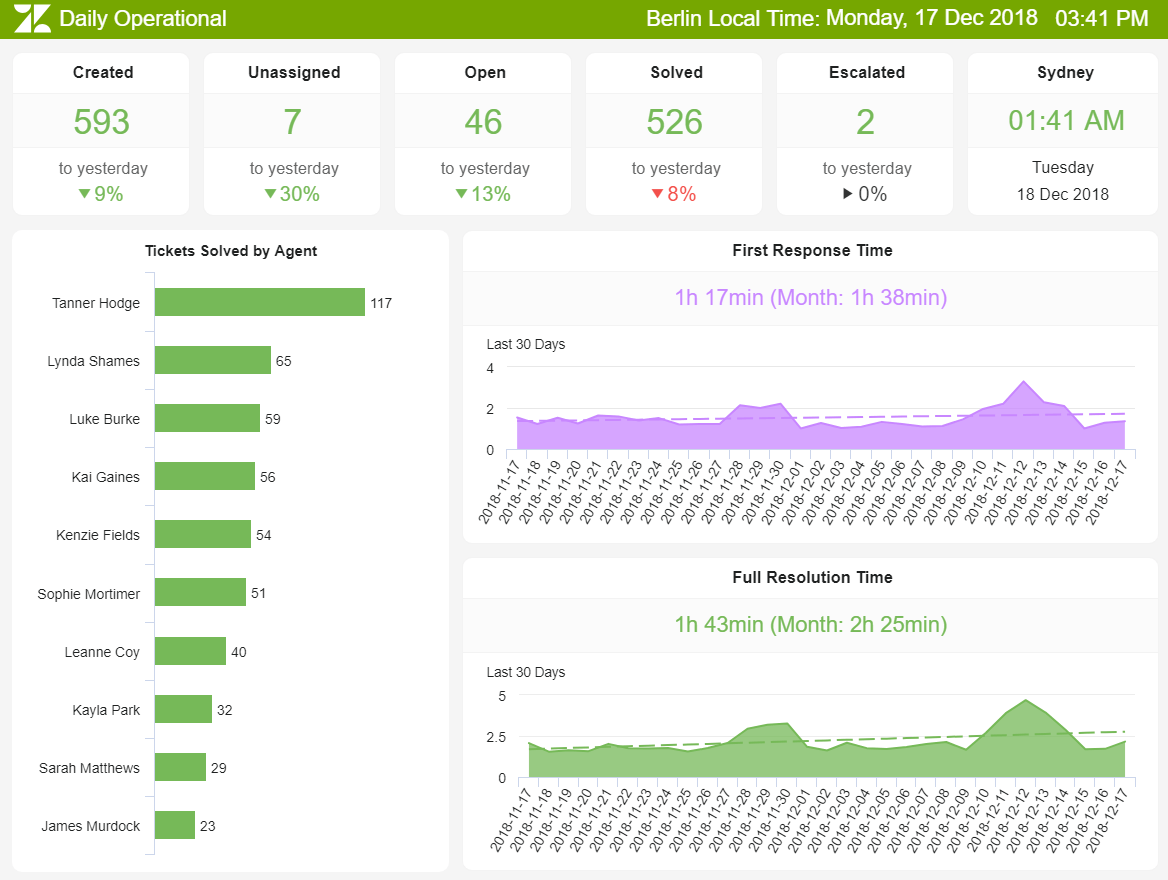
1. Daily Operational Dashboard
**click to enlarge**
Primary KPIs:
- Tickets & Ticket-Status
- First Response Time (FRT)
- Average Resolution Time
To streamline your daily customer support processes, working with an interactive and customizable visual digital dashboard is the way forward – and this particular platform is just the ticket!
Our daily operations platform houses a cohesive mix of service desk KPI examples designed to offer complete logistical transparency while empowering customer service executives to make confident data-driven decisions based on all of your business’s key support areas.
In this example, the “tickets & ticket status,” “first response time,” and “average resolution time” work together in visual harmony to create a centralized customer support nerve center.
When it comes to the everyday operations of your customer service department, it’s easy to become overwhelmed. Customers have more contact points at their disposal than ever before. If you want to manage those touchpoints well, having the right Zendesk KPIs in one central location is the way to ensure success.
With invaluable data on first contact resolution and average resolution time as well as key insights on the status of your tickets and the performance of your agents, a powerful BI dashboard software will enable you to create a modern dashboard that offers all of the tools to squeeze maximum efficiency from your department while solving your consumers’ issues faster and more effectively.
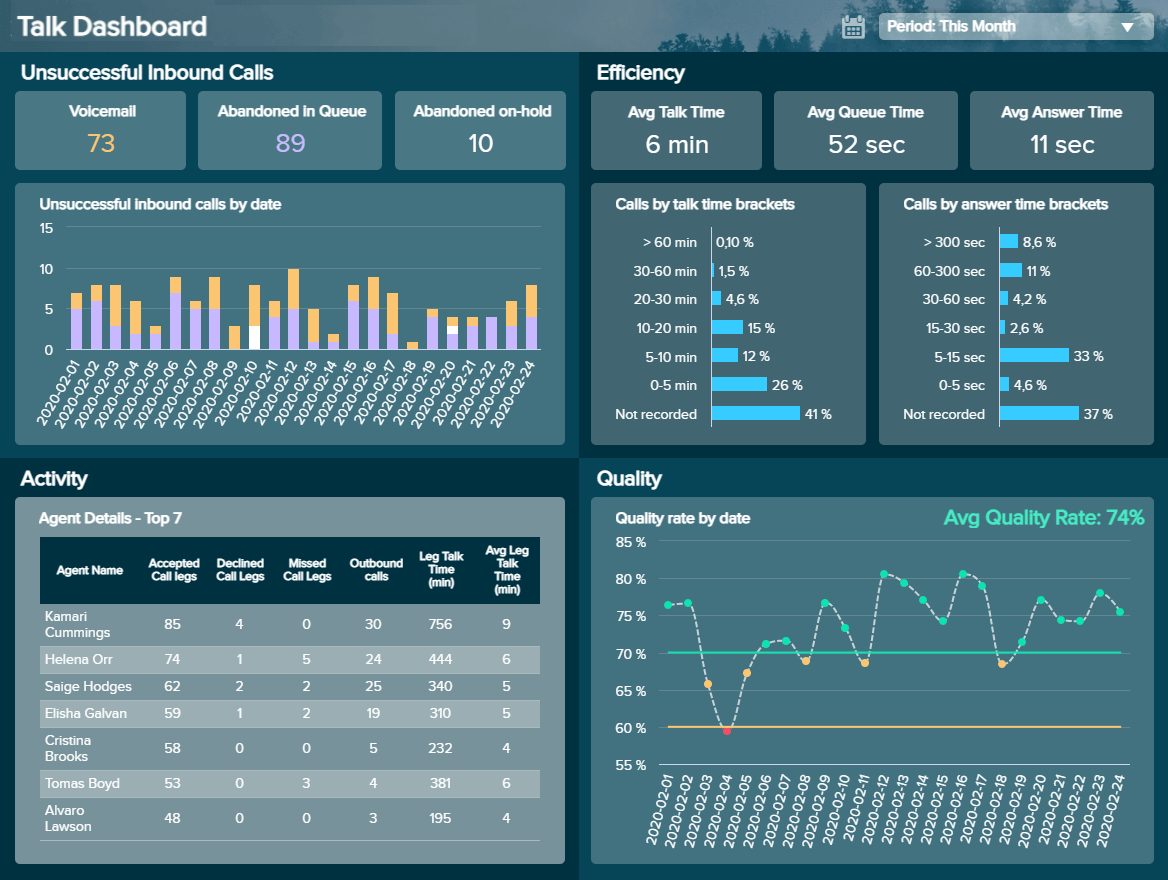
2. Talk Dashboard
The next of our essential daily help desk dashboard examples comes in the form of a talk-based online dashboard divided into four key areas.
**click to enlarge**
Primary KPIs:
- Answer Time
- Leg Talk Time
- Unsuccessful Inbound Calls
- Quality Rate
This highly focused informational hub drills down into metrics relating to support agent call performance based on a mix of relevant factors, such as agent activity, inbound call success (including unsuccessful calls) and efficiency, and overall quality.
A melting pot of operational as well as performance-based information, this well-arranged business dashboard provides dynamic real-time insights, at-a-glance data, and metrics that build a profile of future support strategy or performance.
Built with a modern BI dashboard software for swift, informed decision-making as well as continual call quality and efficiency improvements, this example allows you to connect with all of the information you need to not only make your call or contact center financially efficient but also become more productive, more responsive, and better equipped to meet your customers’ ever-changing queries, needs, and requests.
If you want to improve your brand reputation and boost your customer satisfaction rates sustainably, this is the daily operational support desk dashboard you need at your disposal.
If you get a solid handle on your daily operations, you will see significant improvements in satisfaction and service levels. This will have a profoundly positive impact on the growth of your business.
Help Desk KPI Metrics Best Practices
Now that you’ve seen our best service desk dashboard examples and understand the business-boosting power of help desk KPI metrics, let’s look at the best practices—concepts and considerations that will allow you to get the most from your data.
1. Focus on your existing processes
When working with help desk key performance indicators, many business decision-makers immediately look at metrics based on creating brand new processes or strategies.
While service desk metrics can indeed assist you in formulating new strategies, one of the most important best practices to consider is: to start with your existing processes first. By looking at your existing functions or processes, you will focus on what needs measurement or improvement before moving on to new initiatives.
For example, rather than using your help desk KPIs to set up a completely reworked online customer inquiry journey, you should first use your metrics to focus on first response time and support tickets by channel to improve your call handling efficiency and customer resolution rates across every touchpoint.
Once you’ve tackled your existing roadblocks and processes, you will have solid foundations for tackling new processes or strategies, maximizing the value of your data in the process.
2. Roll out your help desk metrics dashboard at a steady pace
Whether you’re looking to work with one service desk metrics template or several, your ultimate success will depend on the way you roll everything out.
By taking a consistent yet gradual approach, you will have time to train all of your support agents on the software and metrics that will improve their day-to-day duties while integrating any current platform data from other sources with care.
When it comes to customer support, experience, and service, data counts. If you have access to all relevant data from one central dashboard, and all of your support agents understand how to use your service desk reporting metrics, you will optimize your service initiatives across the board without any costly mistakes or hiccups.
3. Offer your customers genuine value
Ultimately, these metrics exist to ensure you can meet your customers’ needs head-on and offer them a deep level of personal value—not just as a one-off but on a consistent basis.
That said, to ensure your help desk KPI dashboard is always optimized for success, you should check in with your customers regularly. By asking your customer base how you can improve your support interactions and services, you will gain an informed understanding of the service desk metrics and key performance indicators that will help you make your communications and strategies the best they can be.
Starting the conversation will also help you build a rapport with your customers and give your future communications a definitive direction. For instance, by incentivizing your customers to leave feedback via email, you can gather intelligence that will help you refine your support KPI selections while opening up an opportunity to send over valuable content, deal offers, or product recommendations that will cement customer loyalty.
Start Your Help Desk Analysis Journey Today!
“Innovation needs to be part of your culture. Customers are transforming faster than we are, and if we don’t catch up, we’re in trouble.” – Ian Schafer
You should never underestimate or undervalue the power of exceptional customer support in the modern age. Your ability to resolve your customers’ issues efficiently while remaining empathetic and personable across all channels and touchpoints will dictate the ongoing success of your business.
Your customer service department is the beating heart of your business – a fact that you cannot afford to ignore. By working with the right mix of KPI examples for service desk activities and embracing the power of a modern support desk metrics dashboard and online business intelligence software, you’ll grow your business in ways you never thought possible.
Take a data-driven approach to your customer support strategy, and you will boost your brand authority, increase consumer retention and loyalty, and see your bottom line grow year after year.
Track these service desk KPI examples today, and you will improve your business’s performance across the board. Now is the time to strike.
Are you ready to take your customer support strategy to the next level? For more insight into how our powerful help desk metrics can improve your business and help you on your journey, start your datapine 14-day free trial today.
Source link