

[ad_1]
Google Search Advocate Daniel Waisberg recently shared insights on data visualization and best practices for monitoring website search traffic in a video tutorial.
This article will explore the tips and techniques he shared, including using Looker Studio dashboards to improve SEO monitoring.
Understanding Dashboard Use Cases
Most data visualizations can be classified into three primary use cases:
- Monitoring Dashboards allow users to quickly identify changes in data, such as spikes or dips in page clicks and click-through rates.
- Data Exploration helps uncover insights by analyzing search performance patterns across various parameters, like countries, devices, or website sections.
- Data Investigation uncovers trends and patterns from aggregated search data, which can help present findings to stakeholders or for public-facing reports.
Google’s tutorial focuses on monitoring dashboards, which are essential for detecting issues as they happen.
Building Monitoring Dashboards With Google Looker Studio
Google Looker Studio, previously known as Data Studio, is a powerful data visualization tool that allows users to create customizable charts and connect data from multiple sources.
To start with Looker Studio, visit Google’s help page to access a monitoring dashboard template and link it to your Search Console data source.
Dashboard Structure & Filters
The example dashboard in Google’s video contains three main sections: Filters, Line Charts, and a Table.
Filters allow you to control the data shown and customize the date range.
Users can also choose between different Search Console properties, page types, countries, and device categories.
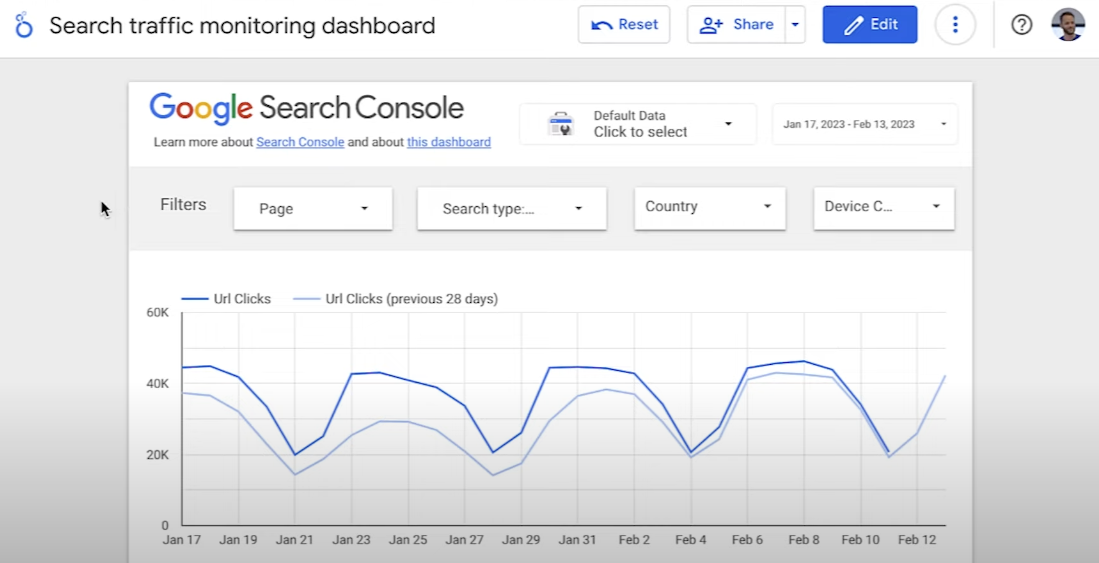 Screenshot from YouTube.com/GoogleSearchCentral, March 2023.
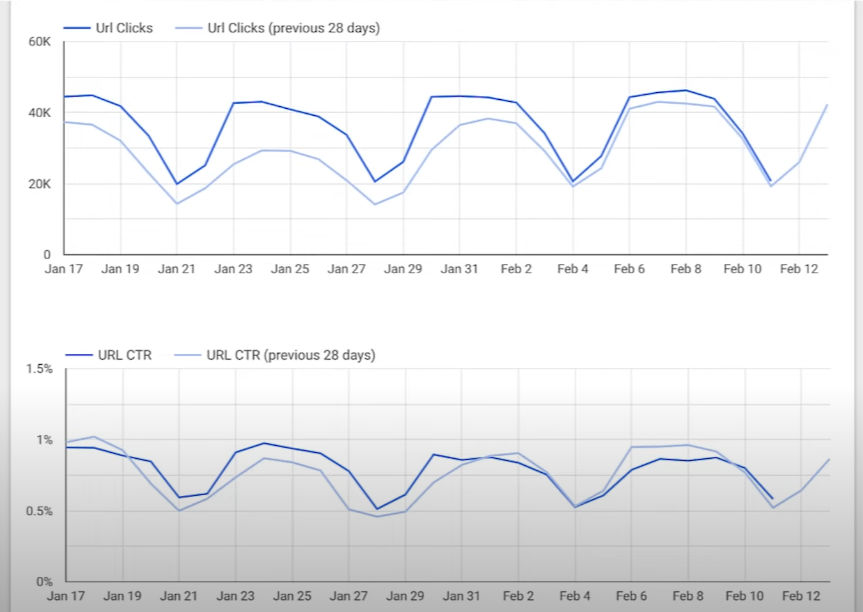
Line Charts For Monitoring Clicks & CTR
Once you have applied the appropriate filters, the line charts display how your metrics change over time.
Using a multiple of seven days in your line charts is a good practice to quickly distinguish between weekday and weekend patterns.
Pay close attention to any deviations from these patterns.
 Screenshot from YouTube.com/GoogleSearchCentral, March 2023.
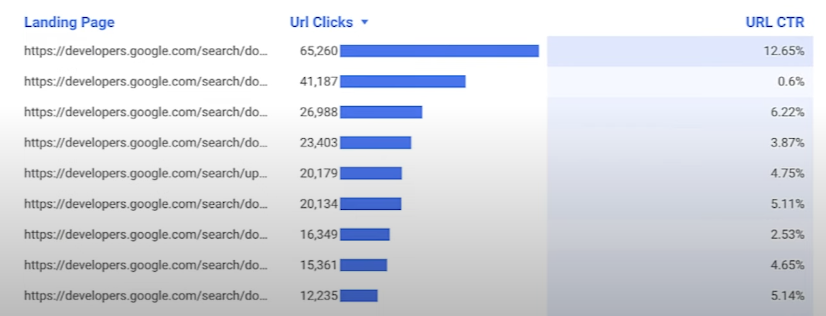
Analyzing Data With Tables
Tables are useful for deeper analysis of specific pages or groups of pages.
You can apply page, country, and data type filters to examine your website’s performance.
 Screenshot from YouTube.com/GoogleSearchCentral, March 2023.
Data Blending In Looker Studio
Data blending functionality in Looker Studio allows users to create charts, tables, and controls based on multiple data sources.
For example, if you have a spreadsheet that maps pages to different website sections, you can create a data source in Looker Studio and join it with your Search Console data.
With this blended data, you can continuously monitor your main metrics by section.
This technique can also be applied to data sources like query clusters or countries/regions.
For more details, see Google’s help page on data blending in Looker Studio.
In Summary
Effective monitoring dashboards can help SEO professionals quickly identify changes in website performance and uncover valuable insights.
The key to creating valuable dashboards is using easy-to-understand visualizations like line charts, bar charts, and tables.
When combined with Google Search Console data, Looker Studio offers powerful tools to build customized, insightful dashboards that can enhance your SEO strategy.
Source: YouTube
Featured Image: Cgwide/Shutterstock
[ad_2]
Source link