The supply chain is the backbone of any modern business: an ever-shifting ecosystem that ensures the smooth, efficient, and consistent delivery of products or services from a supplier to a client or customer.
If your supply chain lacks structure, vision, and efficiency or is fragmented, your commercial growth will suffer. That’s why it’s critical to monitor and optimize relevant KPIs and metrics for supply chain management with pinpoint accuracy.
Supply chain metrics will help you set solid benchmarks for a number of essential processes and activities. And by working with the right KPIs, you stand to make your company more productive, more intelligent, and ultimately, more profitable.
In this post, we will cover essential supply chain KPIs and deliver essential insights about the 25 that you should track for improved logistics processes. We will also show you how to maximize the value of these supply chain performance metrics with the help of modern KPI software to create professional supply chain dashboards.
But first, let’s start with the basic definition.
What Are Supply Chain Metrics?
Supply chain metrics or KPIs are performance indicators used by businesses to assess and optimize the efficiency and productivity of various supply chain processes. This visual information can be used to manage inventory, sales, shipping, suppliers, and more.
Concerning the continual growth, evolution, development, and success of your company’s supply, fulfillment, and delivery efforts, supply chain performance indicators are the most invaluable tools available at your fingertips. By collecting, curating, and analyzing key supply chain metrics (SCM) you will be able to spot inefficiencies within your ecosystem while capitalizing on your current strengths and establishing goals that will help your supply chain scale with the success of your company. While there are numerous KPI examples you can select for your assessment and optimization, we have focused on a list that will enable you to identify potential bottlenecks and ensure sustainable development.
Our Top 25 Supply Chain Metrics Examples
Remember:Today, having access to information 24/7/365 is vital. Cutting-edge online data analysis tools will give you this level of untapped data-driven access, increasing your commercial prospects in the process.
Now that you’re familiar with the official supply chain metrics definition, we’re going to explore a supply chain list with the top 25 indicators that will help you, and your organization, work toward a bright and prosperous future.
Let’s start with a financially-driven supply chain management KPI.
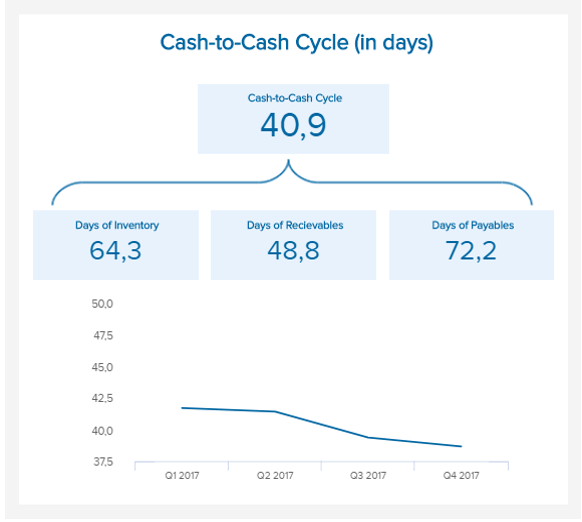
1. Cash-to-Cash Time Cycle
This priceless supply chain metric will help you calculate the length of time required to transform your resources into bonafide cash flows. Working with three core ratios – the days of inventory (DOI), the days of payables (DOP), and the days of receivables (DOR) – the cash-to-cash time cycle KPI visualizes the period required between the moment a business pays cash to its suppliers and the moment it receives cash from its customers. The shorter the conversion cycle the better, and this invaluable supply chain metric will help you take the right measures to ensure that you can run your company with less money tied up in operations.
2. Freight Bill Accuracy
Shipping and freighting your items from supplier to warehouse or warehouse to the consumer is vital to the success of your entire operation, and any issue or error can prove harmful with time and investments being wasted.
Billing accuracy is critical to profitability as well as customer satisfaction, so tracking this particular metric will help you spot detrimental trends, improve your overall shipping accuracy, and ultimately, help your business grow. Here is how freight bill accuracy is calculated:
(error-free freight bills / total freight bills) * 100
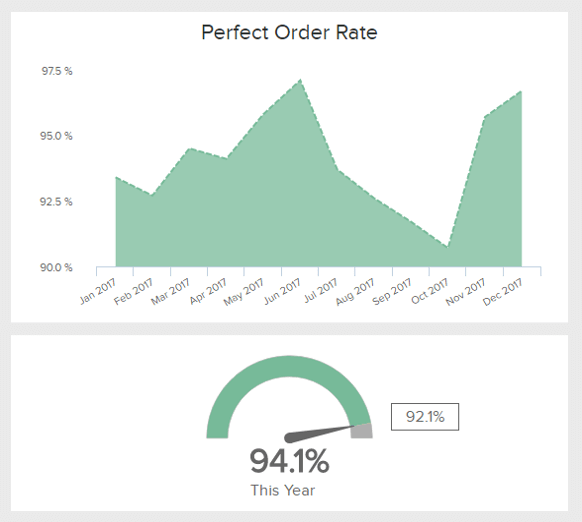
3. Perfect Order Rate
This particular insight is one of the most critical supply chain KPIs for businesses operating in a multitude of sectors. The perfect order rate measures the success of your ability to deliver orders incident-free, which will ultimately help you iron out issues such as inaccuracies, damages, delays, and inventory losses. The higher the perfect order rate, the better, because this KPI has a direct impact on your customer retention and loyalty levels.
4. Days Sales Outstanding (DSO)
The days sales outstanding (DSO) KPI measures how swiftly you are able to collect or generate revenue from your customers.
Essentially, a low, or healthy, DSO number means that it takes an organization fewer days to collect its accounts receivable. A higher DSO level demonstrates that a company is selling its product to customers on credit and taking longer to collect revenue in a tangible sense, which can stunt cash flow and minimize profits in the grand scheme of things. By calculating this often, you’ll be able to collect revenue faster and more efficiently, which will help boost your bottom line in the long run.
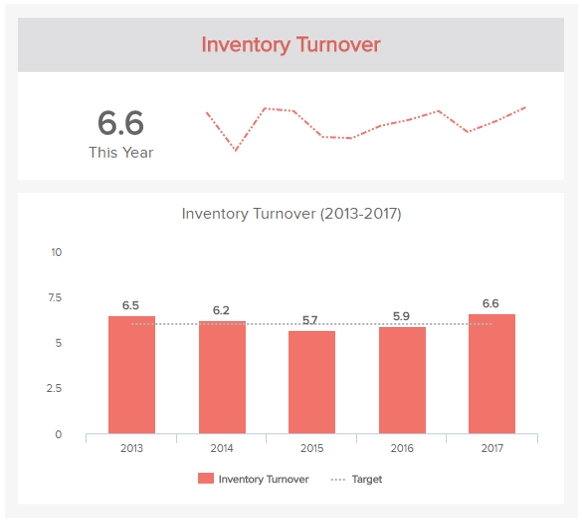
5. Inventory Turnover
One of the most superbly helpful supply chain KPI available today focuses on logistics KPIs and helps a business understand the number of times its entire inventory has been sold over a certain time frame: an incredible indicator of efficient production planning, process strategy, fulfillment abilities, and marketing and sales management. By calculating your on-time shipping rate and comparing it to other competitors within your industry, you will be able to create a clear management reporting practice, see where you stand, and take the appropriate action to improve it over time – this will result in a boost in brand authority as well as an increased bottom line – so it’s important.
6. Gross Margin Return On Investment (GMROI)
Every company, regardless of service, product, or sector strives to achieve the best return on investment (ROI) for each and every commercial activity it undertakes. Maintaining a consistently solid ROI is the bread and butter of ongoing eCommerce success.
In supply chain planning metrics, the GMROI offers a clear representation of the gross profit gained for every AED (or $, £, €, ₺) of the average investment made in your inventory: a calculation achieved by dividing the gross profit by the average inventory investment. By tracking this KPI on a monthly basis, you’ll quickly gain an insight into which items in your inventory are poor performers and which are worth investing in more – gold dust in terms of business-based information.
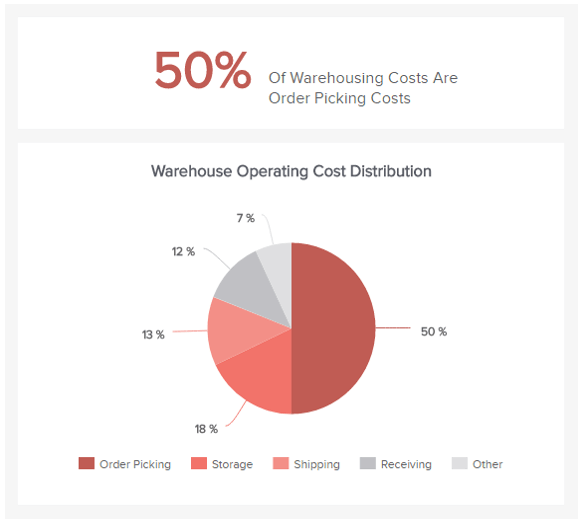
7. Warehousing Costs
We continue our list of supply chain metrics (SCMs) with the warehousing costs. The cost distribution and the management of the time and space of your inventory are critical in establishing a healthy supply chain. While such expenses vary from warehouse to warehouse, it’s important to measure this indicator and review it regularly in order to identify opportunities and decrease unwanted costs. The management of the warehouse facility includes various costs such as labor costs, warehouse rent, utility bills, equipment outgoings, material, and information-handling systems as well as costs related to supplies, ordering, and storing the goods.
Keeping your expenditure on the lower side of the spectrum starts with being well-informed about all the processes that are happening at the warehouse facility and how exactly it operates. That way, you will have a better chance to reduce unnecessary overheads and introduce steps to manage operations more efficiently as well as adjust them when needed. Besides, if you collect your information on a regular basis with the help of a professional online reporting tool, you will have the opportunity to rely upon your reports and make faster, more accurate decisions.
8. Supply Chain Costs
Costs are one of the supply chain KPIs that shows relevant costs that are associated with supply chain management. These outgoings can include planning, managing teams, sourcing, delivering, etc., and it will show how efficient parts of the company are. It’s critical for any organization to increase its profit and reducing costs is one of the strategies that is often applied. That way, the company can identify if there is any space for improvement without the need to increase sales in the process.
However, it’s essential to evaluate what kind of impact the cost reduction will have on the whole supply chain. For example, if your transportation costs are high and you decide to push the speed and weight of trucks, you can risk accidents and potentially detrimental consequences for your business. You may also keep in mind that cutting your overheads in one area of the supply chain can increase in another so careful analysis in this part is essential. You can perform a benchmark or compare yourself with competitors in order to know whether this KPI in the supply chain is steady and healthy or if you need additional adjustments to be competitive. If you want to learn more about costs and the financial side of the company, we suggest you read our guide on financial graphs.
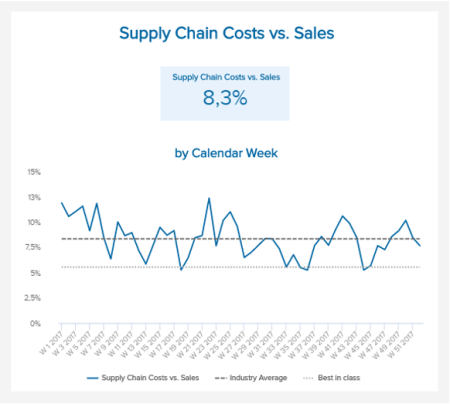
9. Supply Chain Costs vs. Sales
Our list of supply chain KPIs continues with additional cost analysis, connected to sales. This indicator basically calculates your supply chain costs as a portion of sales and, in essence, it will give you an indication of how much you are spending relative to a whole. By calculating such supply chain management metrics, you will be able to perform a healthy spending analysis and establish processes for potential savings. Optimizing the supply chain means reducing costs as much as possible but here, as we mentioned, it’s important to cut costs where it makes sense, and not simply do it to bring down the numbers. The reason is simple: if you cut costs that are consequently increased in another part of your supply chain, the whole process is not very useful.
To know whether you’re successful in comparing your outgoings with sales, you can simply research industry benchmarks or compare your company with competitors. That way, you will know whether your percentage is too low or too high. In any case, it’s critical to compare your insights with the averages of the relevant industry.
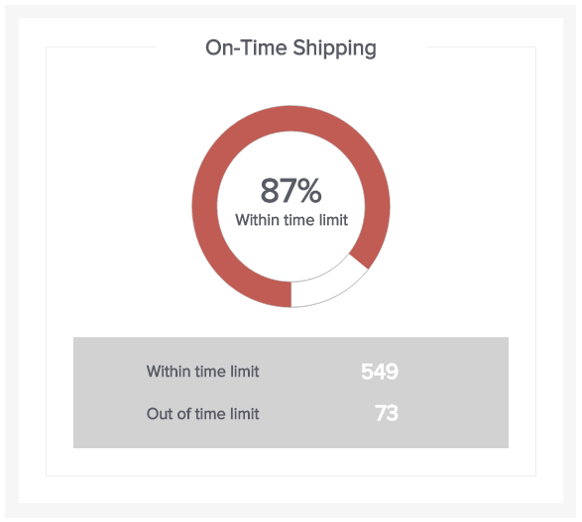
10. On-Time Shipping
Created with a professional KPI tool, the on-time shipping is an excellent indicator of how long you may need to ship a particular type of order to a client, customer, or partner, this visual will allow you to set a benchmark shipping time relative to each product which, in turn, will allow you to optimize your shipping and delivery processes, reducing turnover time, and boosting customer satisfaction levels.
11. Delivery Time
Delivery time is an indicator for the supply chain that focuses on improving service: it measures the amount of time needed from the moment the order is shipped to the delivery on the customers’ doorstep. The order needs to be correctly prepared and the destination reached within a reasonable time frame. Otherwise, the general service may be affected and the impression you leave on your customers: no one likes to wait for 9 months to get their delivered goods.
It makes sense to reduce this supply chain management KPI and create more precision in informing clients when the goods or products will be delivered. It’s much better to state that the delivery will arrive in 4-5 business days in comparison to 1-5 business days. Moreover, if you manage to specify the time, even better for your service. You can also offer special delivery services to decrease the delivery time and see how your customer satisfaction, in the long run, rises. You can even include supply delivery metrics in your performance dashboard focused on the supply chain, and monitor it more closely. Please, see the bottom of this article to take a closer look at a supply chain report.
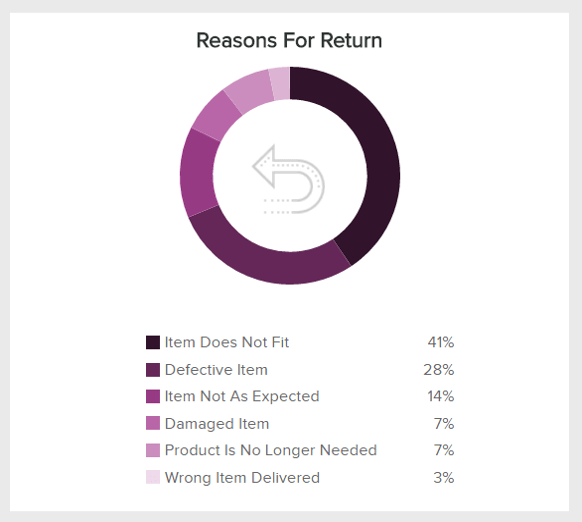
12. Return Reason
The return reason supply chain metric offers an astute insight into the various motives causing your customers and clients to return their orders – a piece of information that is priceless to the ongoing success of an eCommerce company. Presented in a digestible pie chart-style format with a key showcasing the primary reasons for return, you will be able to assess your areas of weakness, analyze the quality of critical areas of your supply chain process, and make the kind of improvements that will enhance not only your reputation but your overall level of service significantly. By gaining this level of insight, you stand an excellent chance at decreasing returns, boosting profits, and improving cash flow as a result.
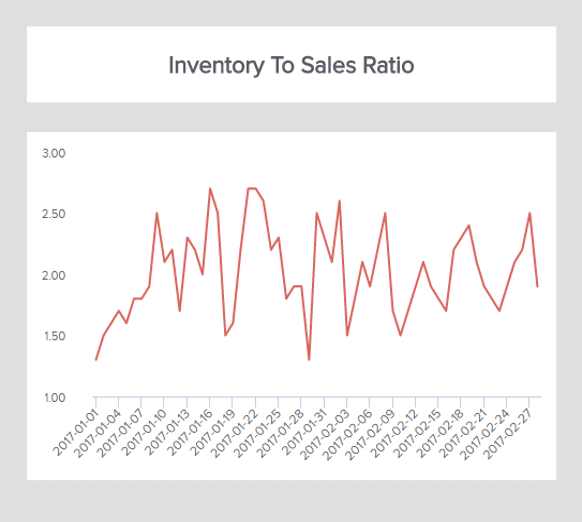
13. Inventory To Sales Ratio
One of the key supply chain metrics on our list, the inventory-to-sales ratio, is critical to track since inventory is one of the most important instruments in your supply chain. This metric measures the amount of inventory for sale in comparison to the actual quantity that is sold, expressed as a ratio. It will help you to adjust your stock in order to ensure high margins and tell you how well your company is dealing with unexpected situations.
Here the main point is that to keep a healthy ratio, you need to know how to balance it properly. It would make sense to keep the ratio not too high since it could affect your inventory turnover rates so the balancing act is essential. A modern dashboard maker can help you in creating an interactive inventory visualization that will update the data automatically and you can monitor the progress in real-time. Moreover, you will be able to adjust your future strategies and ensure there is an optimal ratio, specific to your business.
14. Inventory Velocity (IV)
A pivotal supply chain KPI, the inventory velocity, or IV, provides a visual snapshot of the percentage of inventory that’s projected for consumption within the next period or quarter.
Calculated by dividing the opening stock by the sales forecast for the following period, the IV is an indicator that will help you optimize your inventory levels, give you a greater chance of meeting consumer demand, and prevent you from wasting money on excess levels of stock.
15. Inventory Days Of Supply
While this may not be the most panoramic or all-encompassing of supply chain measurement metrics, inventory days of supply is particularly useful as it will give you a fairly accurate calculation of the number of days it would take you to run out of stock if it wasn’t replenished.
By tracking, analyzing, and understanding these streams of insights on a regular basis, you will be able to prepare for, and avoid, any stock-based calamities in an emergency situation, saving your reputation and cash flow in the process.
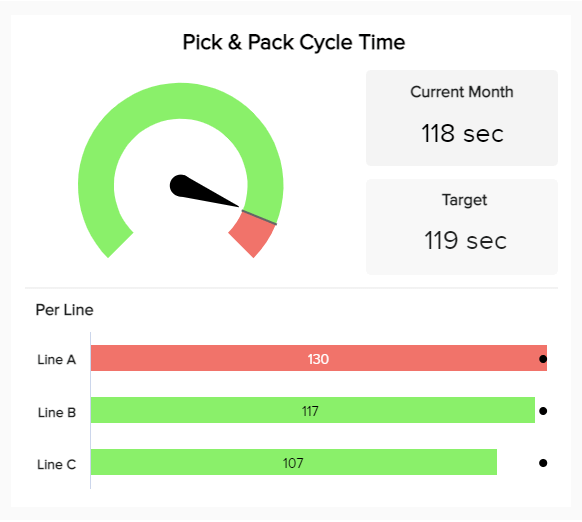
16. Pick & Pack Cycle Time
This supply chain performance measurement will give you an accurate gauge of just how efficient (or inefficient) your entire supply chain cycle is, breaking it down into specific lines. Each metric within the visual is designed to quantify the time from when an employee plucks an item from the shelf to the moment the packing process is complete.
Once you’ve set your targets and started tracking your supply chain cycle progress, it will become clear where delays or weaknesses lie within your supply chain. As a result, you can take targeted action to nip these issues in the bud, driving down your overall cycle times in the process.
17. Fill Rate
The next on the list of supply chain management metrics is fill rate. An essential addition to any valuable supply chain report, this important metric will give you a clear-cut indication of the proportion or percentage of your customers’ orders that are successfully fulfilled the first time around (or during the first shipment).
One of the most popular visuals used to measure supply chain progress, fill rate is directly linked to overall brand reputation and customer satisfaction levels (significant drivers of commercial growth and evolution). You can benchmark your fill rates based on orders delivered, lines delivered, or individual items delivered on the first try. If you spot any discrepancies in your fill rate, you will be able to easily uncover the exact fulfillment factor and boost your fill rate swiftly.
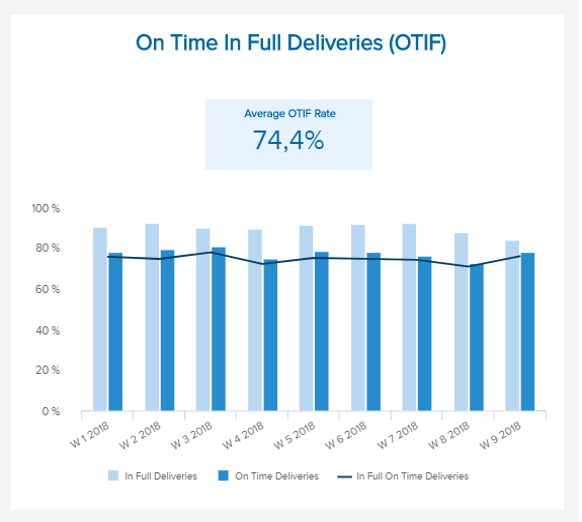
18. Delivered on Time and In Full (OTIF)
In terms of supply chain indicators that matter, OTIF is up there as this most powerful of supply chain KPI examples will give you a panoramic insight into your delivery success over a set timeframe. Delivering your clients’ or customers’ expectations is vital to the ongoing success of your business. As one of the most insightful supply chain efficiency metrics, OTIF will ensure your orders are fulfilled in full and on time.
Based on factors such as whether the right product was delivered to the agreed quality standards, fulfilled in the right quantities, and delivered to the agreed destination, this KPI will help you consistently optimize your outcomes. If your average OTIF rates are lagging, you can use this metric to pinpoint the factors at play and make strategic decisions to tweak your internal strategy or work with more reliable suppliers.
19. Freight Cost per Unit
Metrics in supply chain management are critical for making sustainable improvements, and freight cost per unit is a testament to that notion. One of the most important supply chain KPIs for any scaling business, freight cost per unit will provide you with a solid insight into how economically you can ship your products.
This particular supply chain metrics dashboard addition will measure your overall freight costs divided by the number of units you’ve shipped. You can calculate this metric using any unit that is relevant to your business. Any long-winded or poorly planned processes will cost you time, money, and customer loyalty. This KPI will help you avoid such difficulties.
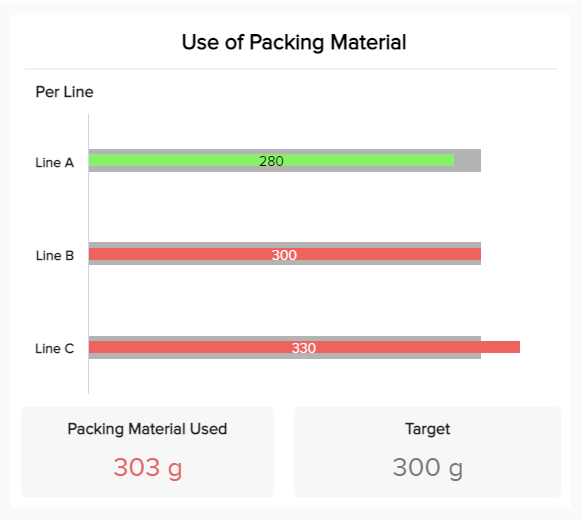
20. Use of Packing Material
The next in our rundown of supply chain KPIs is the use of packing materials. Not only do inefficient packing processes cause unnecessary waste, but they will sap your business’s budget. This scannable supply chain KPI will help you confidently track the amount of packing materials used for every line in your pick & pack process.
By setting a target or benchmark for your packing usage (in this example, it’s 300g), you can stay on top of your packaging usage and nip any potential issues in the bud. By re-evaluating your packing strategies before they get out of hand, you will save money while boosting your brand reputation as a result of your newfound sustainability.
21. Supply Chain Cycle Time
As one of the key supply chain metrics for any scaling business, this supply chain cycle time is incredibly telling when it comes to tracking your end-to-end efficiency. Essentially, this powerful visual information presents insights into how long it would take to fulfill a customer’s order if your inventory levels were at zero.
The shorter your cycle, the more agile, adaptable, and efficient your chain is across the board. By tracking this indicator frequently, you can zoom into any potential roadblocks slowing down your processes and take targeted action.
22. Damage-Free Delivery
Whatever goods or products you deal in, a certain level of product loss damage is inevitable. But when the situation starts spiraling out of control, budgets and customer relationships can become strained. To keep tabs on your delivery processes and keep in-transit product damage to a minimum, working with the right information is critical.
One of the most vital supply chain performance metricsfor businesses, damage-free delivery will give you an accurate overview of how many packages made it to their destinations intact. By using both real-time and historical trend-based insights, you can pinpoint where the problem lies (from troublesome fulfillment partners or delivery providers to poor product packaging) and nip it in the bud.
23. Days Sales of Inventory (DSI)
Next in our rundown of essential supply chain metrics examples is days sales of inventory or DSI. This savvy supply chain KPI dashboard insight will help you calculate how many days your products or inventory stay in stock over a specific timeframe.
This information is valuable because it allows you to pinpoint how effective your sales and merchandising efforts are, as well as how successful your inventory buying processes are in relation to your customers’ needs or preferences. If you see your DSI rising, you can hone in on the reason and formulate strategies that will see your stock flying off the shelves.
24. Turn-Earn Index (TEI)
If you’re looking to get a firm grip on how well your organization uses its inventory, this most insightful of supply chain efficiency metrics is something to consider. Turn-earn index, or TEI, marries your gross margin and inventory turnover to hone in on your organization’s approach to inventory management. Here, you will discover how you utilize your inventory in relation to your ongoing profits, which is essential if you want to create long-term growth.
Tracking this insight regularly will give you a clear gauge of how high or low your inventory needs to be to generate a healthy profit, giving you the tools to tweak your processes and strategies for maximum efficiency. Here’s the official formula for your reference:
Turn-earn index = (inventory turnover ratio x gross profit percentage) x 100
As a rule of thumb, most businesses across industries set a TEI benchmark of at least 150.
25. Freight Bill Accuracy
Last but certainly not least on our list of essential supply chain KPI examples, we have freight bill accuracy. This most telling of supply chain performance indicators has a direct link to your overall customer satisfaction rates, as well as your brand reputation. By measuring your freight bill accuracy, you will gain a panoramic view of your order fulfillment precision. Here is the formula for your reference:
Freight bill accuracy= (number of correct freight bills / total freight bills) x 100
Working with this particular supply chain KPI, you can see how many shipments went out successfully (the right orders, quantities, shipping info, and delivery journeys) over a specific timeframe. Again, if you see your number of inaccurate orders rising, you will be able to take immediate action before things spiral out of control.
Working closely with this insight will keep your fulfillment rates consistently high, driving customer satisfaction, loyalty, and retention rates.
Supply Chain Management Dashboard Examples
Thanks to modern online data visualization tools you can create stunning supply chain management analytics tools with all your needed KPIs with a few clicks.Every KPI in supply chain management works cohesively to paint a vivid picture that will propel your organization forward. These examples will demonstrate how:
1. Supply Chain Management Dashboard
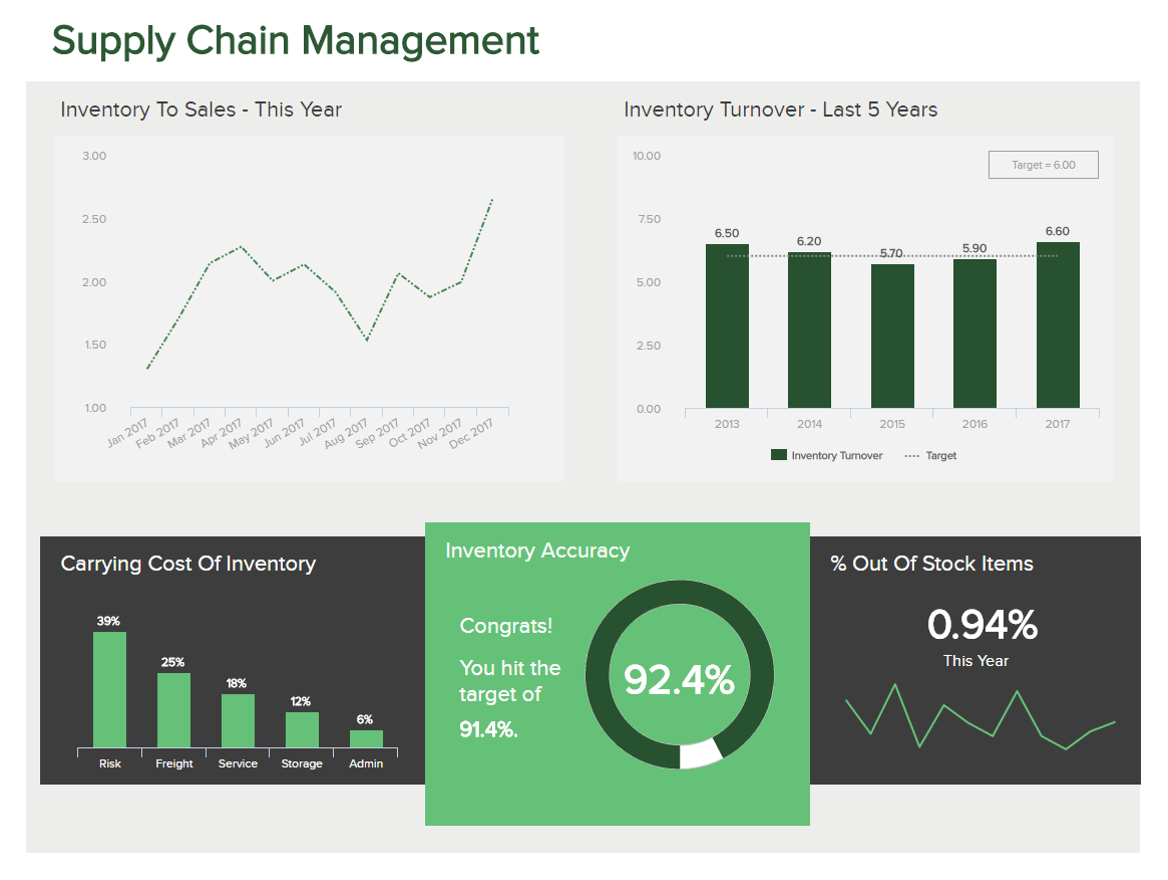
In the example below, we have collected insights focusing on inventory metrics: Inventory-to-Sales ratio, which you can combine with the Inventory Turnover, and clearly see the financial stability of your business. The next KPI of this particular tool is the carrying cost of inventory, followed by inventory accuracy and out-of-stock items. The goal in this example is to avoid wasting money, retain customers, and define the stability of a business.
**click to enlarge**
There’s no denying it: optimal supply chain management conducted in a continually consistent, strategic, and data-driven manner will yield incredibly fruitful long-term results – the kind that will help your business evolve and scale over time.
One of our most powerful business dashboards, the supply chain dashboard boasts a digestible, functional, and visual representation of all key areas of supply chain performance, from inventory accuracy and turnover to the inventory-to-sales ratio. By drilling down into inventory management logistics, this particular reporting tool (which can also be used as an interactive dashboard) will help you deal with unexpected supply chain situations, enhance your stock buying practices, reduce operational as well as financial inefficiencies, significantly improve the accuracy of your and a great deal more. Your stock is essential to your commercial operation which is why tracking your inventory through a central nerve center will make sure that every supply chain effort and initiative improves the way you run your business as opposed to hindering it.
By tracking these critical supply chain performance visuals in one initiative space, you will be able to implement initiatives that not only hold maximum value but will also ensure the smooth running and perpetual improvements of your supply chain processes, ensuring that every single cog in the wheel is turning to maximum efficiency – which of course, is priceless.
If you want to learn how to create a supply report like this one, check out our insightful guide with examples from different industries and functions.
2. Supply Chain Costs Dashboard
Consumer goods are another important industry that relies on effective supply chain management. Especially when it comes to cost optimization, there should be not much room for ignoring the financial analysis as it can cause serious damage to the bottom line. A comprehensive BI dashboard can help you in automating your KPIs and ensure you focus on what really matters: the information, visuals, and insights in front of you.
**click to enlarge**
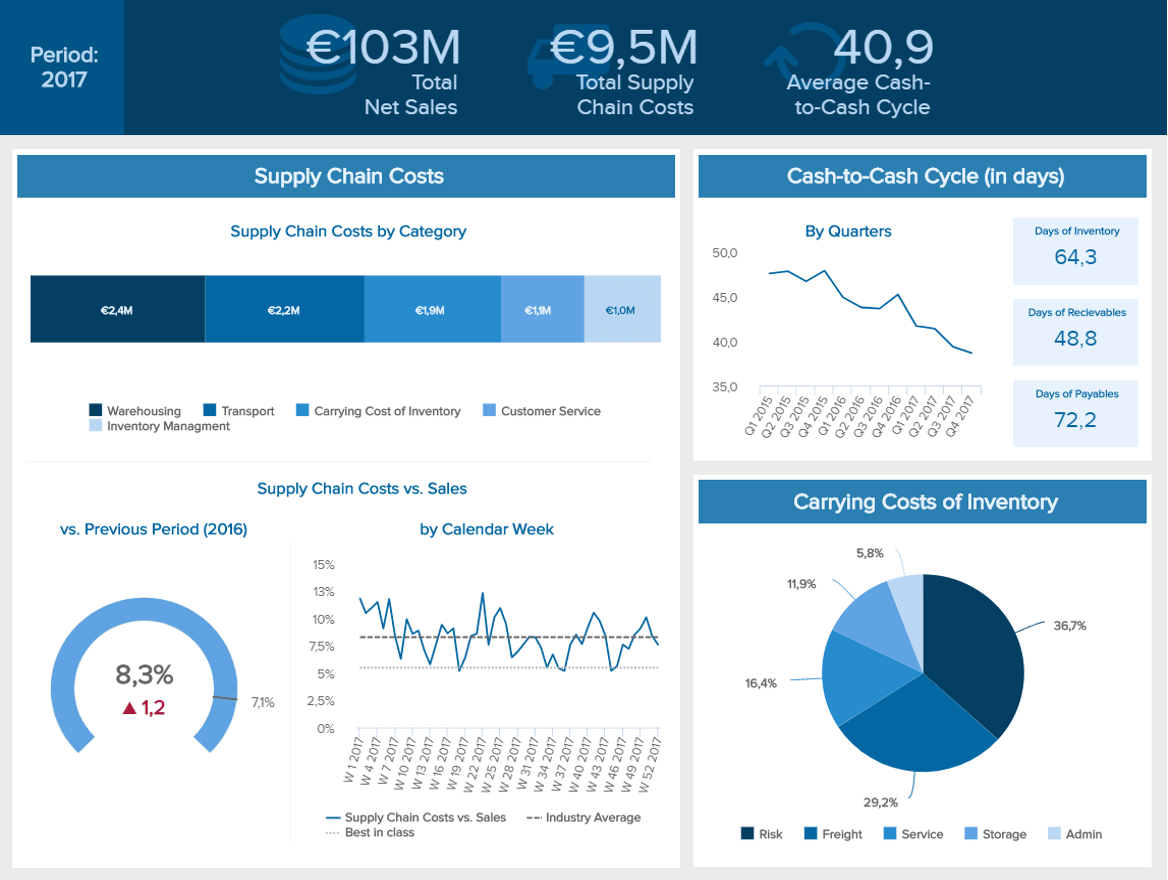
On top of this supply chain metrics dashboard, you can see a quick overview of the total net sales, total supply chain costs, and the average cash-to-cash cycle, all-important supply chain management metrics to start your presentation. On the left side are represented supply chain costs by category that includes warehousing, transport, carrying costs of inventory, customer service, and inventory management. Below these indicators, there is a clear overview of the supply chain costs vs sales. This KPI is additionally broken down by calendar week and compared to the previous period. We have already analyzed this metric so we won’t go into much detail but the important thing to keep in mind is to track this metric and perform a more detailed spend analysis and, finally, adjust if needed.
On the right side of this supply chain performance dashboard is additional cost-related essential info: the cash-to-cash cycle and carrying costs of inventory. These visualizations are essential if you want to know how much cash you need to finance ongoing operations and how much profit you can make based on your inventory. Such an online dashboard you can easily create with supply chain dashboard software.
3. Warehouse KPI Dashboard
As a busy warehouse manager trying to keep everything smooth and successful, supply chain metrics are your friend. Working with the right supply chain management metrics will help you keep track of vital costs, shipments, and inventory, even under pressure.
**click to enlarge**
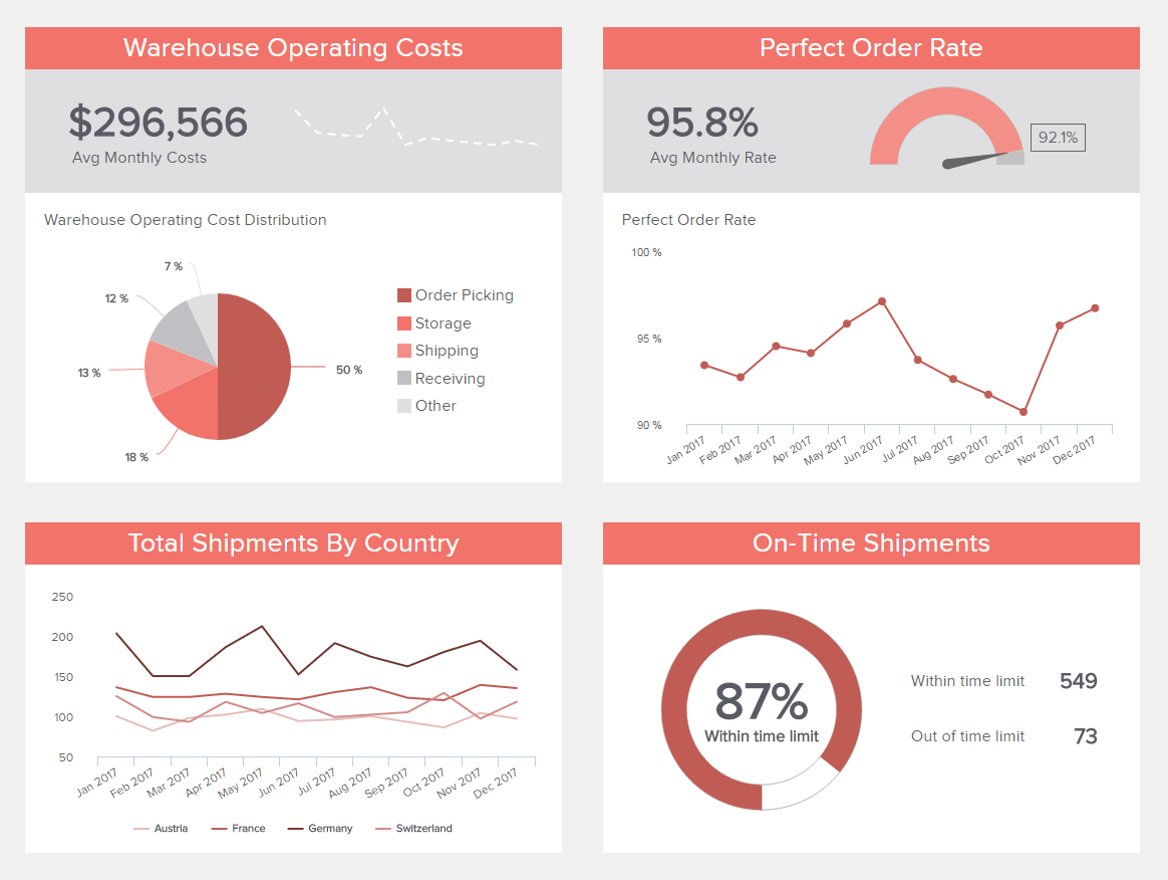
Our dynamic warehouse KPI dashboard is designed to uncover critical trends as well as essential real-time information in a way that is completely digestible. Here, you can monitor your on-time shipping costs, analyze total shipments according to region or country, break down key operating costs, and view your perfect order rates at a glance.
Not only does this melting pot of visual insights offer the tools to help warehouse managers make continually valuable tweaks to their operational strategies, but it’s also built to improve the decision-making process. If an issue arises, it’s possible to spot the problem within minutes, communicate with the right operatives, and respond swiftly.
Being as adaptable as possible is critical for success when it comes to supply chain management. The insights contained within this supply chain KPI dashboard make being responsive more than possible in almost every situation.
Why Are Supply Chain Metrics Important?
Now that we’ve covered supply chain key performance indicators examples and the dashboards that bring them to life, we’re going to reflect by answering the question: Why are supply chain metrics important?
Supply chain-based metrics are vital to your company’s core fulfillment and logistics strategy for many reasons. In fact, studies say that the supply chain analytics market is expected to reach a value of $16.82 billion by 2027. This is due to the fact that using analytics for supply chain decision-making helps businesses improve their operational, strategic, and tactical efficiency.
Here are the main benefits and reasons why KPI tracking is so important in supply chain management:
Communication & cohesion
The key to a successful supply chain is communication. Once everyone involved in the process has a deeper understanding of their role while gaining access to the info required to maximize their potential, every cog in the supply chain machine will become smoother, more economical, and more reliable.
KPIs and metrics like this provide unified access to invaluable data – the kind that will improve communication, aid collaboration, and ensure your inventory is managed economically while every product travels from your warehouse to the end recipient without a hitch.
Focused data & supply chain insights
In the age of information, fulfillment processes can become overly complicated due to the ever-growing number of sources, platforms, and touchpoints to analyze. Wading through an ever-expanding pile of data quickly becomes an uphill struggle when you’re managing busy supply chains. But KPIs will give you the power to focus exclusively on the insights that matter.
Supply chain-based metrics visualize what really counts from one centralized location in a visual format that is digestible. Working with supply chain-style info will help you not only run your logistical operations better but also identify any rising issues (gaps in inventory, a lack of inventory, bottlenecks in your delivery processes, etc.) before they snowball or spot hidden trends that will significantly improve your overall strategy.
Responsivity & adaptability
Supply chain KPI performance indicators are critical, as they will give you all of the insight you need to remain responsive and adaptable at all times. Successful supply chain management commands 100% adaptability in every situation. If something goes wrong (and when you’re talking about supply chains with several stages to consider, something almost always will at some point), you must be able to fix it immediately.
As customer demands continue to evolve, and the business landscape keeps on shifting, ensuring your supply chain is robust will set you apart from the pack. Supply chain-focused metrics will give you the confidence and intelligence to make valuable strategic changes to your processes based on the landscape around you while confidently making in-the-moment decisions thanks to target data visualizations you can analyze at a glance. The more consistently you meet or exceed your client’s or consumer’s fulfillment expectations, the more your business will grow – supply chain-based visuals will help you do just that.
By being able to make projections that offer real value and make informed choices under pressure, you will optimize your supply chain for consistent success in a competitive commercial world. This, in turn, will maximize your growth and profitability.
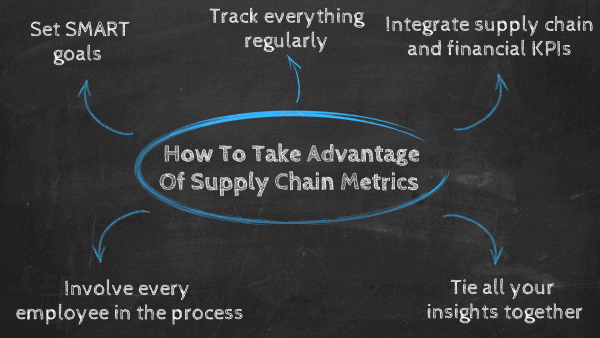
How To Take Advantage Of Professional Supply Chain Metrics & KPIs
Now that you’re up to speed with the value and practical function of supply chain KPIs and supply chain quality metrics, let’s look at how you can use them to your maximum business-boosting advantage. We’ll start with taking a SMART approach to your informational choices.
1. Set SMART goals
To set the right insights for your supply chain analytics strategy, you should set SMART KPI goals. Working through this selection framework will ensure you work with the visualizations that offer genuine value to the business.
To select suitable insights through the SMART framework, you should ensure that your goals (and all associated visualizations) are:
Work through each goal in a collaborative environment step by step, and you will lay solid foundations for your supply chain-based analytical efforts.
2. Track everything regularly
This may sound glaringly obvious, but you’d be amazed at just how many logistics managers overlook this essential detail.
As the supply chain is subject to constant change, and each step of the process has the potential to hit roadblocks at any point, tracking your key indicators regularly is critical. Decide which real-time insights you will need to consult on a daily basis before splitting the remaining ones into weekly, bi-weekly, and monthly categories.
When it comes to tracking supply chain-centric insights, consistency is key. Having set times to track certain insights will ensure everything flows smoothly and that you don’t miss a beat. To remain as responsive as possible, setting up alerts based on certain benchmarks or criteria is always a good idea.
3. Integrate financial and supply chain insights
Supply chain quality and financial KPIs go hand in hand. Any process that you can improve logistically will have a positive impact on your company’s financial health. Conversely, logistical mismanagement will have a negative impact on your company’s ongoing financial health.
By merging these two sets of insights together, you will be able to discover direct correlations between how you manage your inventory or fulfill orders and fiscal progress or growth.
Spotting these links will empower you to use your analytical tools to drive down unnecessary costs while streamlining processes for maximum financial efficiency.
4. Tie all of your insights together
To squeeze every last drop of value from your visual insights, tying them all together in one cohesive, interactive BI dashboard is the way forward.
By placing everything on one centralized platform, all of your supply chain KPIs examples will work in unison to deliver a wealth of insight from one interactive screen. By doing so, you will be able to drill down into every essential component of your supply chain and make valuable decisions in real time.
Gaining a panoramic view will give you the intelligence to see how each insight complements one another, making your analytical efforts all the more informed, powerful, and profitable.
5. Make sure everyone’s tapped into the ecosystem
Last but not least, to get the most from your metrics, it’s vital that you ensure that everyone involved with your supply chain has access to the indicators, tools, and insights to perform to the best of their abilities.
To ensure every stage of the chain is well-oiled and fully optimized, everyone must work together. If you train your personnel and give them access to the right informational tools, everyone will be on the same page.
Armed with this collective wealth of insight, you will ensure that your supply chain pushes your company ahead of the pack, one smart initiative at a time.
Summary & Next Steps
Recent studies suggest that 79% of companies with high-performing supply chains earn a revenue growth greater than the average within their sector. Moreover, the usage of the software is growing 9% year over year, showing that this clear-cut value of developing an efficient supply chain lies within modern solutions to improve a company’s performance.
That’s where the power of the dashboard comes into play. If you want to create a data-driven company, save countless hours in the analysis processes, and work with real-time data, dashboards are a great way to do so. And for more data-driven wisdom, check out these great dashboard designs that you can get inspiration from.
So, what are metrics in the supply chain? Well, here is a summary of our top 25 supply chain KPIs we discussed in detail:
Cash-to-cash Time Cycle
Freight Bill Accuracy
Perfect Order Rate
Days Sales Outstanding (DSO)
Inventory Turnover
Gross Margin Return On Investment (GMROI)
Warehousing Costs
Supply Chain Costs
Supply Chain Costs vs Sales
On-time Shipping
Delivery Time
Return Reason
Inventory To Sales Ratio
Inventory Velocity (IV)
Inventory days of supply
Pick and pack cycle time
Fill rate
On-time and in-full deliveries
Freight cost per unit
Use of packaging material
Supply chain cycle time
Damage-free delivery
Days of sales inventory
Turn earn index (TEI)
Freight bill accuracy
“Continuous improvement is better than delayed perfection.”—Mark Twain
The only way to iron out issues and drive continuous evolution is to track, measure, and monitor the right information using the right tools and techniques. Supply chain benchmarking metrics and supply chain KPIs will give you the power to make every single phase of your operation fluent, communicative, and built for ongoing success.
Yes, each of these essential supply chain-centric KPIs will make your organization stronger, smarter, and more economically efficient from the ground up. By making your supply chain completely cohesive from start to finish, you will accelerate your business’s growth in ways you never thought possible – and it all starts with the right insights.
Are you ready to work with the supply chain metrics that matter? If you want to track and visualize your supply chain metrics and KPIs with pinpoint accuracy and complete convenience, you can try our modern logistics analytics software for a free 14-day trial.